|
Communication Technology |
||
|
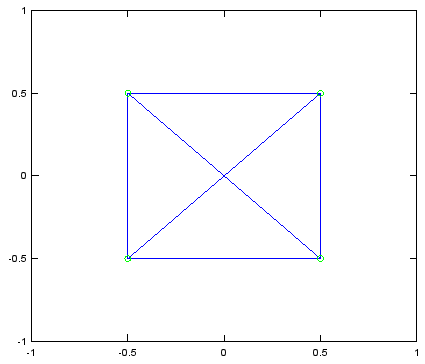
I/Q Constellation
mlevel = 2; n = 100; s_i = round((mlevel-1)*rand(1,n))-(mlevel-1)/2; s_q = round((mlevel-1)*rand(1,n))-(mlevel-1)/2; plot(s_i,s_q,'-',s_i,s_q,'go'); axis([-mlevel/2 mlevel/2 -mlevel/2 mlevel/2]);
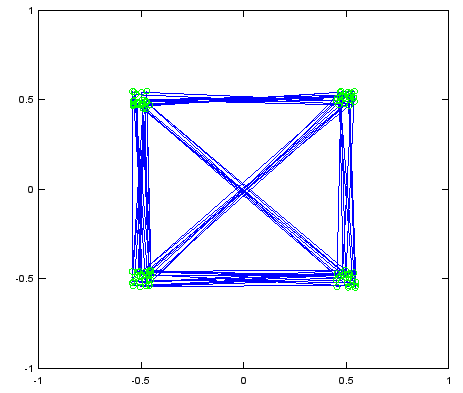
mlevel = 2; n = 100; rAmp = 0.1; s_i = (round((mlevel-1)*rand(1,n))-(mlevel-1)/2) + (rAmp*rand(1,n)-0.5*rAmp); s_q = round((mlevel-1)*rand(1,n))-(mlevel-1)/2 + (rAmp*rand(1,n)-0.5*rAmp); plot(s_i,s_q,'-',s_i,s_q,'go'); axis([-mlevel/2 mlevel/2 -mlevel/2 mlevel/2]);
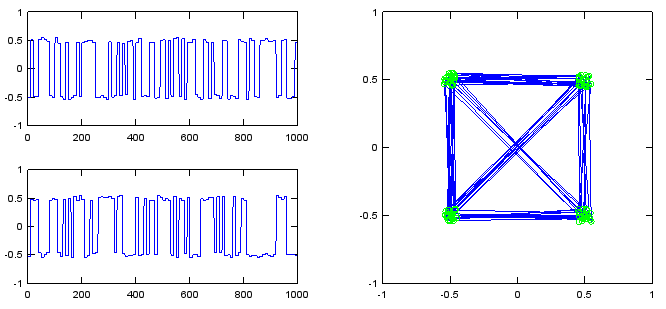
mlevel = 2; n = 100; rAmp = 0.1; s_i = (round((mlevel-1)*rand(1,n))-(mlevel-1)/2) + (rAmp*rand(1,n)-0.5*rAmp); s_q = round((mlevel-1)*rand(1,n))-(mlevel-1)/2 + (rAmp*rand(1,n)-0.5*rAmp);
% Folowing is to display digital pulse for the signal sf = 10; path_i = s_i; path_q = s_q;
if sf > 1 for i = 2:sf path_i= [path_i ; s_i]; path_q= [path_q ; s_q]; end
path_i = reshape(path_i,[],1); path_q = reshape(path_q,[],1); end
subplot(2,2,1); plot(path_i);axis([0 length(path_i) -mlevel/2 mlevel/2]); subplot(2,2,3); plot(path_q);axis([0 length(path_i) -mlevel/2 mlevel/2]); subplot(2,2,[2 4]); plot(path_i,path_q,'-',s_i,s_q,'go'); axis([-mlevel/2 mlevel/2 -mlevel/2 mlevel/2]);
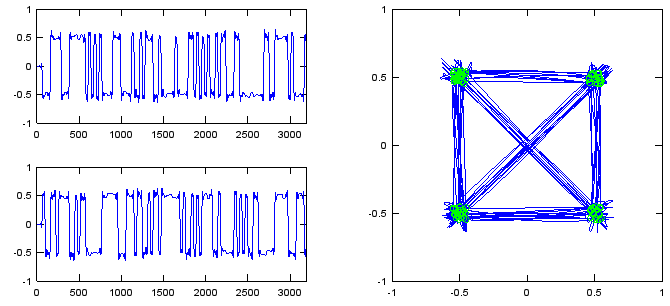
mlevel = 2; n = 100; rAmp = 0.1; s_i = (round((mlevel-1)*rand(1,n))-(mlevel-1)/2) + (rAmp*rand(1,n)-0.5*rAmp); s_q = round((mlevel-1)*rand(1,n))-(mlevel-1)/2 + (rAmp*rand(1,n)-0.5*rAmp);
% Folowing is to display digital pulse for the signal sf = 32; path_i = s_i; path_q = s_q;
if sf > 1 for i = 2:sf path_i= [path_i ; s_i]; path_q= [path_q ; s_q]; end
path_i = reshape(path_i,[],1); path_q = reshape(path_q,[],1); end
b = fir1(128,0.10,'low');
path_i = filter(b,1,path_i); path_q = filter(b,1,path_q);
subplot(2,2,1); plot(path_i);axis([0 length(path_i) -mlevel/2 mlevel/2]); subplot(2,2,3); plot(path_q);axis([0 length(path_i) -mlevel/2 mlevel/2]); subplot(2,2,[2 4]); plot(path_i,path_q,'-',s_i,s_q,'go'); axis([-mlevel/2 mlevel/2 -mlevel/2 mlevel/2]);
|
||