Vibration - Rigid Body
Undamped free vibration of a rotating body refers to a frictionless periodic motion that is maintained by gravitational or elastic restoring forces. Pendulum is an example of a rigid body that exhibits free vibration. In reality, any rotating bodies with a periodic motion without external applied force(s) is subjected to a damped free vibration because of frictional effects at the pin joint(s). Free vibrations occur upon releasing an object after applying a small displacement.
Like any dynamics problems, the vibration analysis of rotating bodies should start with illustrating the free-body diagram and stating the equation of motion. Figure 1 illustrates a periodic motion of a rigid body with a small angular displacement and its corresponding free-body diagram, respectively. The mass and rotational moment of inertia at the center of mass are known quantities.
< Figure 1: Periodic motion of a rigid body >
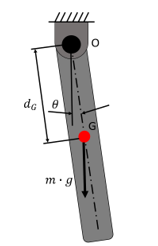
The equation of motion for the rotating body depicted in figure 1 is modelled as follows, where the sum of moment is taken at the pivot point, o:

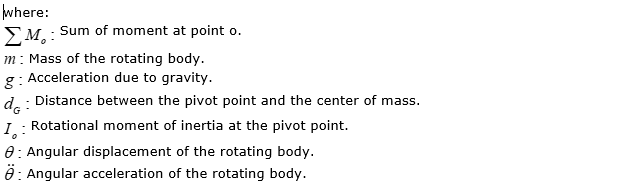
As sin(θ) can be approximated to θ for a small angular displacement,

< Figure 2: Periodic motion of a plate fixed to a torsional rod. >
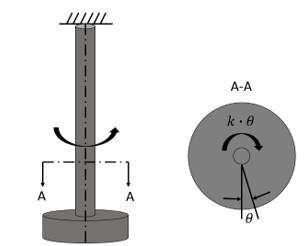
Using the known rotational frequency, the natural frequency is calculated as follows:

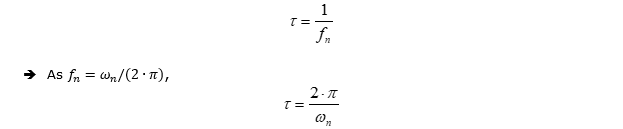
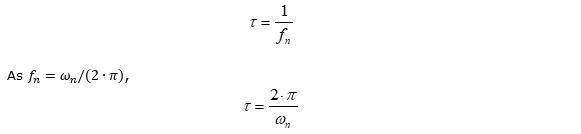
The period of oscillation is equal to the reciprocal of the natural frequency.

Example 1: Python for modelling the period of oscillation of a pendulum subjected to undamped free vibration.
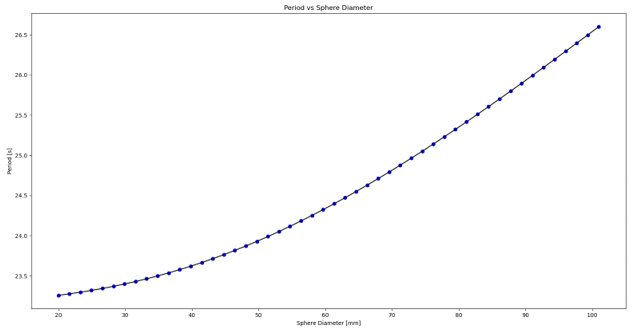
Create a plot that represents the relationship between the period of oscillation and diameter of the sphere fixed to the end of a rod. The rod has a diameter of 10 mm and a length of 200 mm. The diameter of the sphere ranges from 20 mm to 100 mm. Include both scatter and line plots. Figure 3 depicts the pendulum motion and its corresponding free-body diagram. The density of the material for both the rod and sphere is 0.00271 kg/mm^3.
< Figure 3: Periodic motion of a pendulum. >

Mathematical Modeling:
Step 1: Analysis of mass and inertial properties.
Mass of the rod and sphere

Position of center of pendulum mass with respect to the pivot point (i.e., point O from figure 3)
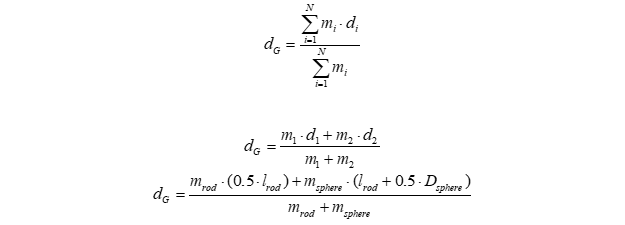
Rotational moment of inertia at the pivot point

Step 2: Rotational frequency analysis.
Modeling the pendulum motion

Rearranging the equation of motion into the 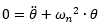 form,
form,

Step 3: Period of oscillation.
Python Code:
import numpy as np
import matplotlib.pyplot as plt
# Inputs
# rho : Material density [kg/mm^3].
# D_rod : Rod diameter [mm].
# l_rod : Rod length [mm].
# D_sphere : Sphere diameter [mm].
# Output
# T : Period of oscillation [s].
# Define the inputs
rho = 0.00271
D_rod = 10
l_rod = 200
D_sphere = np.linspace(20,100) # 20, 21, 22, ..., 100
g = 9.81 # N/kg
# Analysis of mass and inertial properties.
m_rod = rho*np.pi*D_rod**2*l_rod/4
m_sphere = rho*np.pi*D_sphere**2/3
d_G = (m_rod*(0.5*l_rod) + m_sphere*(l_rod + 0.5*D_sphere))/(m_rod + m_sphere)
I_O = 1/12*m_rod*l_rod**2 + 1/10*m_sphere*D_sphere**2 + (m_rod + m_sphere)*d_G**2
# Rotational frequency analysis.
omega_n = np.sqrt((m_rod + m_sphere)*g*d_G/I_O)
# Period of osciallation.
T = 2*np.pi/omega_n
SF_rod = 90/(m_sphere*g/(np.pi*D_rod**2/4))
SF_rod_critical = np.min(SF_rod)
# Create the plot to show T vs D_sphere
plt.figure()
plt.plot(D_sphere,T,'bo',D_sphere,T,'k') # Blue dots and black lines
plt.show()
Python Results:
< Figure 4: Relationship between the period of oscillation and sphere diameter for the pendulum. >
Example 2: Python for modelling the period of oscillation of a plate fixed to a rod with known stiffness subjected to undamped free vibration.
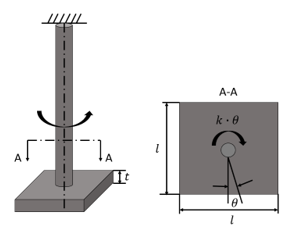
Create a plot that represents the relationship between the period of oscillation and a square plate fixed to the end of a rod subjected torsion with a side length that ranges from 20 mm to 40 mm. The thickness of the plate is 2 mm, the plate has a density of 1.05(10)-6 kg/m3, and the rod has a stiffness of 0.005 Nm/rad. Include both scatter and line plots. A small angular displacement of θ is applied to the rod. Figure 5 depicts the motion and the corresponding free-body diagram for the circular plate.
< Figure 5: Periodic motion of the square plate fixed to the torsional rod.>
Mathematical Modeling:
Step 1: Analysis of mass and inertial properties.
Mass of the square plate

Rotational moment of inertia at the pivot point

Step 2: Rotational frequency analysis.

Step 3: Period of oscillation.
Python Code:
import numpy as np
import matplotlib.pyplot as plt
# Inputs
# rho : Material density [kg/mm^3].
# l : Side length of the square plate [mm].
# t : Thickness of the square plate [mm].
# k : Rod stiffness [N*m/rad]
# Output
# T : Period of oscillation [s].
# Define the inputs
rho = 1.05*10**(-6)
l = np.linspace(20,40) # 20, 21, 22, ..., 50
t = 2
k = 0.005
# Analysis of mass and inertial properties.
m_plate = rho*t*l**2
I_O = 1/6*m_plate*l**2
# Rotational frequency analysis.
omega_n = np.sqrt(k/I_O)
# Period of osciallation.
T = 2*np.pi/omega_n
# Create the plot to show T vs l.
plt.figure()
plt.plot(l,T,'bo',l,T,'k') # Blue dots and black lines
plt.xlabel('Square Length [mm]')
plt.ylabel('Period [s]')
plt.title('Period vs Square Length')
plt.show()
Python Results:
< Figure 6: Relationship between the square length and period of oscillation for a square plate fixed to the rod subjected to torsion.>

Reference :