|
Python |
||
|
Python -Plotting Antenna Radiation Pattern
NOTE 1 : This example requires some additional package Panda, Numpy, matplotlib. Followings are the versions of Python and these packages that I used for this example.
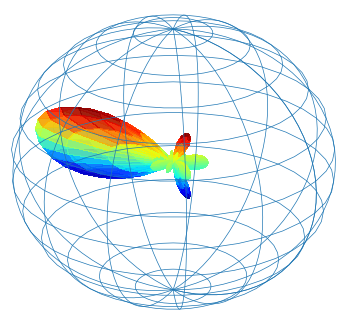
This example program is to plot in 3D the Antenna Radiation Power measured across the surface of a spherical coordinate. The CSV sample file that I used is here. This is a csv file with three columns with the column header of 'Theta', 'Phi','Power'. Open the csv file first and look how the data is structured before you look into the code.
The data in the file is not the real measurement data since I am not allowed to share the real measurement data that I have in public domain. The purpose of this example is to provide you a template with which you can plot your own data with just a little bit of modification.
EIRP_Plot.py =====================================================
import pandas as pd import numpy as np import matplotlib.pyplot as plt import mpl_toolkits.mplot3d.axes3d as axes3d
# Read data file and plot df = pd.read_csv('EIRP_Data.csv')
theta1d = df['Theta'] theta1d = np.array(theta1d); theta2d = theta1d.reshape([37,73])
phi1d = df['Phi'] phi1d = np.array(phi1d); phi2d = phi1d.reshape([37,73])
power1d = df['Power'] power1d = np.array(power1d); power2d = power1d.reshape([37,73])
THETA = np.deg2rad(theta2d) PHI = np.deg2rad(phi2d) R = power2d Rmax = np.max(R)
X = R * np.sin(THETA) * np.cos(PHI) Y = R * np.sin(THETA) * np.sin(PHI) Z = R * np.cos(THETA)
fig = plt.figure()
ax = fig.add_subplot(1,1,1, projection='3d')
ax.grid(False) ax.axis('off') ax.set_xticks([]) ax.set_yticks([]) ax.set_zticks([])
ax.plot_surface( X, Y, Z, rstride=1, cstride=1, cmap=plt.get_cmap('jet'), linewidth=0, antialiased=False, alpha=0.5, zorder = 0.5)
ax.view_init(azim=300, elev = 30)
# Add Spherical Grid
phi ,theta = np.linspace(0, 2 * np.pi, 40), np.linspace(0, np.pi, 40) PHI, THETA = np.meshgrid(phi,theta) R = Rmax X = R * np.sin(THETA) * np.cos(PHI) Y = R * np.sin(THETA) * np.sin(PHI) Z = R * np.cos(THETA)
ax.plot_wireframe(X, Y, Z, linewidth=0.5, rstride=3, cstride=3)
plt.show()
Following is the result of this script.
|
||