Matlab Toolbox - 4G/LTE
Primary Synchronization Signal (PSS)
If you don't know what PSS (Primary Synchronization Signal) is, refer to Physical Layer Signal : PSS (Primary Synchronization Signal) page first.
< PSS Symbol Generation >
This part shows how to generate PSS symbols (modulated date) which will be allocated for each RE (Resource Element) in PSS region in LTE Downlink Radio Frame.
% Since PSS is determined by each eNodeB, you have to define properites of a eNodeB.
% NDLRB indicate System Bandwith in the unit of RBs.
% NDLRB 6 = 1.4 Mhz, NDLRB 15 = 3.0 Mhz, NDLRB 25 = 5.0 Mhz,
% NDLRB 50 = 10 Mhz, NDLRB 75 = 15 Mhz, NDLRB 100 = 20 Mhz
% CellRefP indicate number of downlink Antenna. CellRefP = 1 means 1 transmission antenna (SISO)
% NCellID indicate PCI (Physical Channel Identity) of the Cell
% NSubframe indicate the subframe number. Since PSS resides only in a specific subframe,
% you need to specify the proper subframe number here.
enb.CyclicPrefix = 'Normal';
enb.NDLRB = 6;
enb.CellRefP = 1;
enb.DuplexMode = 'FDD';
enb.NCellID = 0;
enb.NSubframe = 0;
% if you pass the eNodeB information (enb) into ltePSS(), it will generate OFDM symbols for the specified PSS.
% pss_arrayIndex is just a sequence of integer which will used to plot PSS symbols.
pss = ltePSS(enb);
pss_arrayIndex = 0:length(pss)-1;
% Following is to represent PSS symbols.
subplot(1,3,1);
plot(real(pss),imag(pss),'ro','MarkerFaceColor',[1 0 0]);
title('Constellation');
subplot(1,3,[2 3]);
plot(pss_arrayIndex,real(pss),'ro-',pss_arrayIndex,imag(pss),'bo-');
xlim([0 max(pss_arrayIndex)]);
title('PSS index vs PSS value. Red -> real, Blue -> Imaginary');
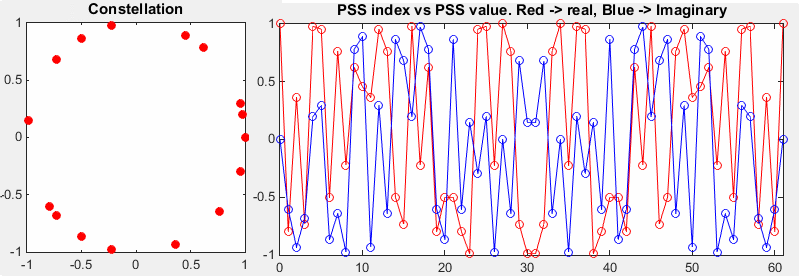
Following is the result of the code listed above with some variable changes.
If you see the left plot (constellation), you would notice PSS is a ZadOff Chu sequence. As you see in the right side graph, PSS is made up of 62 symbols.
|
enb.CellRefP = 1; enb.NCellID = 0; |
|
|
|
|
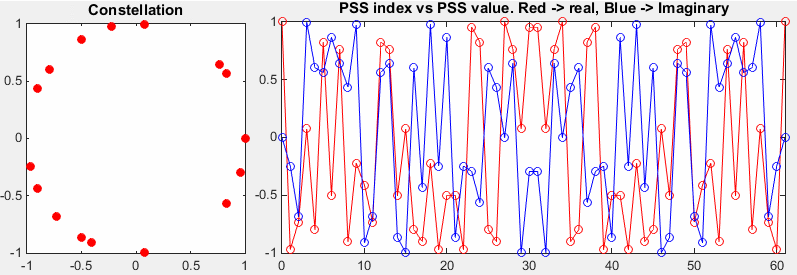
The only difference between this example and previous example is NCellID. If you compare this with previous example, you would notice that the sequence of symbols are different. It means PSS sequence varies with NCellID (PCI : Physical Cell ID)
|
enb.CellRefP = 1; enb.NCellID = 1; |
|
|
|
|
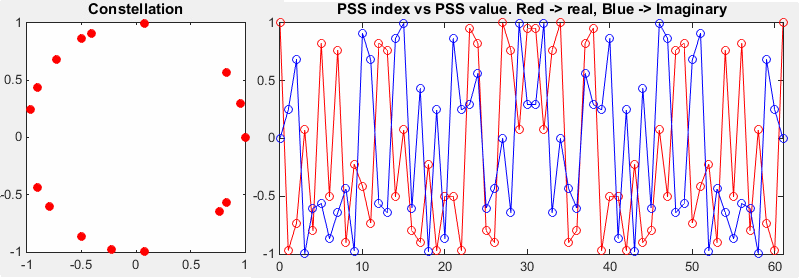
The only difference between this example and previous example is NCellID. If you compare this with previous example, you would notice that the sequence of symbols are different. It means PSS sequence varies with NCellID (PCI : Physical Cell ID)
|
enb.CellRefP = 1; enb.NCellID = 2; |
|
|
|
|
If you have Matlab LTE Toolbox, plot more cases with different NCellID (e.g, NCellID 3,4,5,6,7,8...) and see how the PSS pattern varies.
Disclaimer ! :
This page is only to show you the overall logics and visualization for various LTE physical layer channels. I haven't investigated much about verifying about the accuracy.
If you think the code is not so efficient, it is 100% my fault. I haven't made any effort for effiecient code. I just tried to create code as simple as possible for the readers. As you know, easy-to-read code is not always efficient for a specific chipset.
If you find any mistake in terms of accuracy, it is also very highly likely be my fault. Not the problem of Matlab tool box itself.
Any comment and corrections if you find any mistake will be welcome and appreciated.