This is about a concept which is almost the first concept you would face when you learn Calculus. It is about Limit which almost everybody including me so often get confused with. (So don't worry if you get confused or have difficulties understanding clearly. It is not only you -:)
- What Does the Limit Symbol Say?
- How Do the Tables Show the Approach?
- What If the Function Is Not Defined at the Point?
- What If the Two Sides Disagree?
- How Does a Limit Work with Two Variables?
- How Is the Limit Defined Precisely?
What Does the Limit Symbol Say?
The limit symbol is short, but it packs a whole sentence into a few characters. Let's read it on a function whose answer we already know, so that the symbol and the idea can be checked against each other.
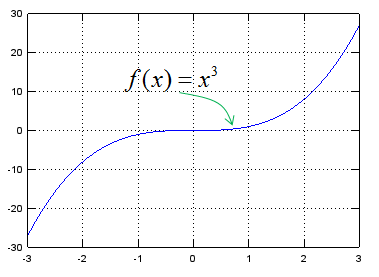
Let's assume that we have a function as shown below.
Now you are asked to draw an answer to following question.
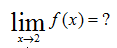
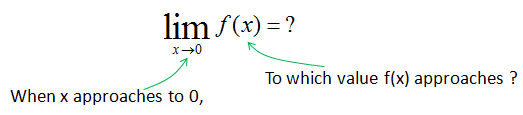
First you have to understand the meaning of each symbol. The meaning of this symbol and expression is as shown below.
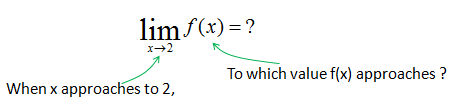
Do you understand what it means ? As you see, 'Limit' is a symbol to show that a variable 'approach' to a certain value. It does not mean that a variable is 'equal' to a certain value. The important thing is to understand the differences between 'approach' and 'equal'. When we say 'equal', it means that we can pick a specific number for the variable, but when we say 'approach', it means that we know it is getting closer to a specific number but we cannot pick any specific value for it. So when we use 'Limit', we don't know what is the exact value for the variable (x in this example) and in return we don't know what is the result of a function (f(x) in this example), but we know that as the variable approaches to a certain value, the f(x) approaches to a certain value.
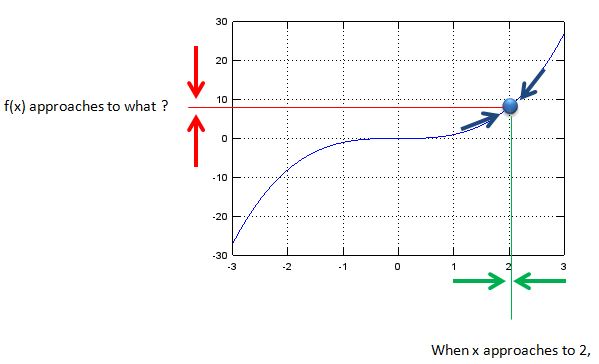
Here f(x) = x3, the curve plotted at the start of this section. Plugging in x = 2 gives 8 straight away, so this example has an easy answer. The tables in the next section still matter, because they show what the limit means when plugging in is not allowed.
The limit asks about the neighbourhood, not the point : the value f(2) plays no part in the limit of f(x) as x → 2. Only the values of f near 2 count.For a continuous function, the limit equals the value : when f is continuous at a, the limit as x → a is simply f(a). x3 is continuous everywhere, so its limit at 2 is 8.The interesting cases are the other ones : a hole in the curve, a jump, or a formula that gives 0/0. The sections below take them one at a time.
How Do the Tables Show the Approach?
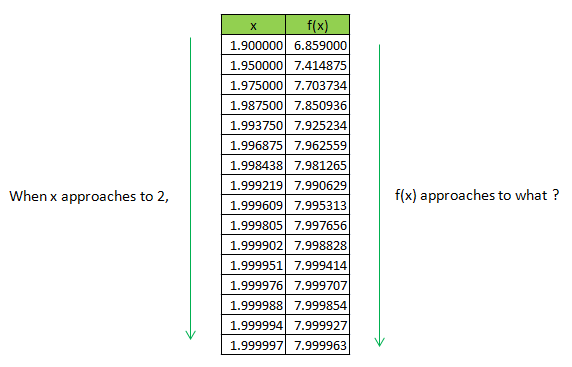
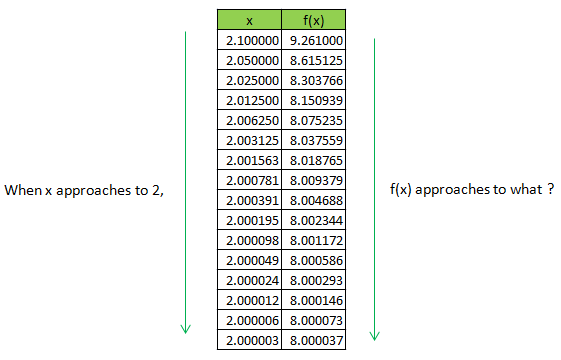
Look at the following table, if you see the colum x you will notice that it is getting closer to the value 2. In this table, the last value is 1.999997 but this does not mean that it ends there. You can keep continuing the table to infinite length like 1.999997, 1.9999997, 1.999999, 1.9999999 you can not specify any end specific end value (this is a concept which makes almost everybody feel very uncomfortable).
Now let's look at f(x) column. How the value changes ? It is approaching to a certain value (it is 8 in this case), but it does not have any specific end value as I described above.
Look at the following table, if you see the colum x you will notice that it is getting closer to the value 2. In this table, the last value is 2.000003 but this does not mean that it ends there. You can keep continuing the table to infinite length like 2.000003, 2.0000003, 2.0000002, 2.0000001 you can not specify any end specific end value (this is a concept which makes almost everybody feel very uncomfortable).
Now let's look at f(x) column. How the value changes ? It is approaching to a certain value (it is 8 in this case), but it does not have any specific end value as I described above.
If I illustrate this example (and concept of Limit) in a graph, it could be as follows. The arrow is to indicate 'something is getting closer (approaches) to a certain destination, but it never arrives to the destination'.
The table values come from f(x) = x3, with x = 2 - 0.1/2k in the left-side table and x = 2 + 0.1/2k in the right-side table, for k = 0 to 15. Each row halves the distance to 2. Near the end of each table, the distance from f(x) to 8 is about 12 times the distance from x to 2. That factor 12 is the slope of x3 at x = 2.
Both tables approach 8, one from below and one from above : the left-side table stays under 8 and the right-side table stays over it. When both sides agree, the limit exists.No row of the table is the answer : every row is still some distance from 2. The limit is the value the rows get arbitrarily close to, not a value in the table.A table can mislead : it shows a finite number of rows, and a function can change behaviour closer in than the last row. Use a table to guess a limit, and use algebra to confirm it.
What If the Function Is Not Defined at the Point?
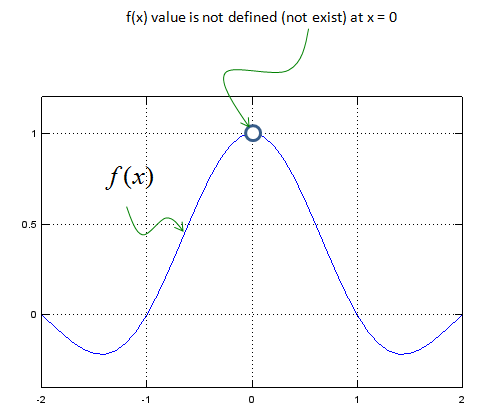
A limit earns its place when plugging in fails. The next function has a hole at x = 0. The function has no value there, but the curve on both sides heads for the same height.
Let's look at another example as shown below.
What is the answer to following question ?
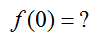
It does not have answer because the function is not defined (does not have corresponding value) for x = 0.
Then can you get the answer to the following question ?
Just by looking at the graph, you will notice that as x approaches to 0, f(x) approaches to 1.
The curve in the graph matches f(x) = sin(πx)/(πx). It crosses zero at x = -1 and x = 1, and it dips to about -0.217 near x = 1.43. At x = 0 the formula gives 0/0, which is not a number. Yet sin(πx) and πx shrink together as x approaches 0, and their ratio approaches 1.
f(0) and the limit at 0 are different questions : f(0) has no answer, while the limit as x → 0 is 1.0/0 is a signal, not an answer : it means the numerator and the denominator both go to zero, and the way they shrink decides the limit. The Limit - Problem Solving page lists ways to settle it.The hole can be filled : defining f(0) = 1 makes the function continuous. Signal processing defines the sinc function in exactly this way.
What If the Two Sides Disagree?
A limit can also fail to exist where the function does have a value. The step function below is defined at x = 0, but the two sides of the graph head for different heights.
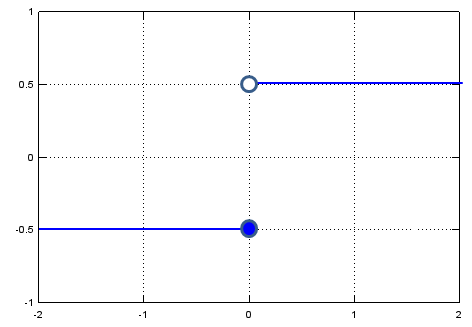
What is the answer to the following question ?
By looking at the graph, you would notice f(x) is -0.5. Then what is the answer to following question ?
Now you would have problem, because you would get different answers depending on which direction you are getting closer to the specified point(x = 0 in this case). Therefore, there is no answer to this question.
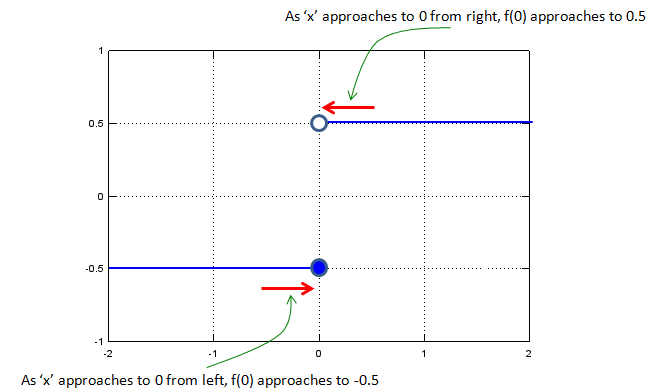
For this kind of situation, they came up with a little bit modified symbol as shown below. We put small sign symbol (+ or -) right next to the value to indicate the direction we have to approach.
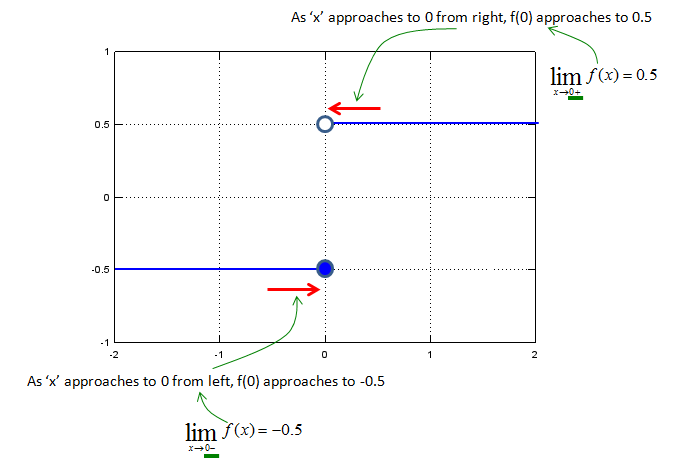
Two labels in the diagrams above need a correction. The notes read "f(0) approaches", but the quantity that approaches is f(x). The value f(0) is fixed at -0.5, shown by the filled dot. The open dot at 0.5 marks a height that the right side approaches but never takes.
The two-sided limit exists only when both one-sided limits agree : here the left limit is -0.5 and the right limit is 0.5, so the limit of f(x) as x → 0 does not exist.The value at the point does not settle it : f(0) = -0.5 matches the left side, but the right side still disagrees.Engineers meet this shape all the time : a switch that closes at t = 0 produces a step. Its two one-sided limits describe the state just before and just after the switch.
How Does a Limit Work with Two Variables?
What if we deal with multi variable function as shown below ? (It has two variables x and y). Like the single variable case that we saw above, we can think of a situation where two variables approaches to specific values. Following is an example.
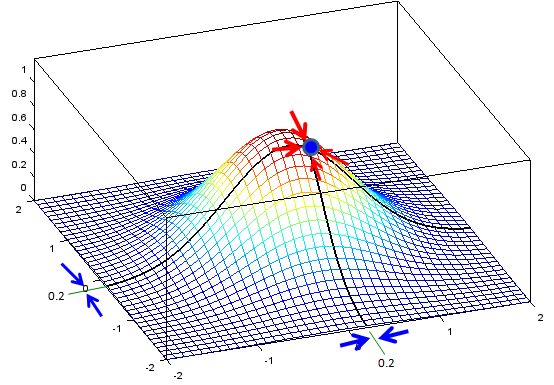
You can express this situation in mathematical form as shown below. I would not ask you to come out with answers.. but I think you already understand the basic concept for the limit of multi variable function.

If you are OK with what I described above and it is too simple for you, check if you can still understand the meaning of the limit when the function is a complex variable function or vector function. I would not come back this topic right away, but in real engineering you would see more of the case for complex function or vector functions. (I will come back to this topic, when I complete all the basic pages).
With two variables there is a new difficulty. In the single variable case, x can approach 0.2 from only two sides. The point (x, y) can approach (0.2, 0.2) along any line or curve in the plane, and the limit exists only if every path gives the same value. The surface in the graph above is smooth, so all paths agree there.
A counterexample shows what can go wrong. Take f(x, y) = xy/(x2 + y2) near the origin. Along the x axis the value is 0. Along the line y = x it is 1/2, and along y = mx it is m/(1 + m2). The value depends on the path, so the limit at the origin does not exist.
Two paths that disagree prove that there is no limit : this is the quickest test, and the example above uses it.Paths that agree prove nothing on their own : g(x, y) = x2y/(x4 + y2) goes to 0 along every straight line through the origin. Along the curve y = x2, however, it equals 1/2. A proof needs a bound that holds in all directions at once, as in the next section.Complex and vector limits follow the same idea : a complex variable z approaches a point in a plane, so it meets the same path question. A vector function has a limit when each of its components has one.
How Is the Limit Defined Precisely?
The word 'approach' has carried every section so far. Mathematicians replaced it with a test that uses only inequalities, called the epsilon-delta definition. You do not need it to compute limits, but it shows what the tables and graphs were really checking.
The statement lim f(x) = L as x → a means the following. For every tolerance ε > 0, however small, there is a distance δ > 0 such that 0 < |x - a| < δ guarantees |f(x) - L| < ε. In words, you can bring f(x) as close to L as anyone asks, by keeping x close enough to a but not equal to it.
Let's test it on f(x) = x3 at a = 2 again. The table below gives, for three tolerances, a distance δ that is small enough, and the worst error inside that distance. The worst case is always at x = 2 + δ.
Tolerance ε |
Distance δ |
Largest |x3 - 8| for |x - 2| < δ |
0.1 |
0.008 |
about 0.0964 |
0.01 |
0.0008 |
about 0.00960 |
0.001 |
0.00008 |
about 0.000960 |
Each error stays under its tolerance, and the same pattern works for any smaller ε. So the limit of x3 at 2 is 8 in the strict sense, not only in the sense of the tables.
ε is the challenge and δ is the answer : a limit exists when every challenge, however small, has an answer.The condition 0 < |x - a| leaves out the point itself : this is why the hole in the sin(πx)/(πx) graph does not matter.The definition also explains the jump : for the step function, take ε = 0.25. Points just left of 0 sit at -0.5 and points just right sit at 0.5, and no single L is within 0.25 of both. So no δ works, and there is no limit.Practice comes next : the Limit - Problem Solving page collects methods for 0/0 cases, and the L'Hospital's Rule page covers one of them in detail.