|
Electronics |
||
|
Loadline
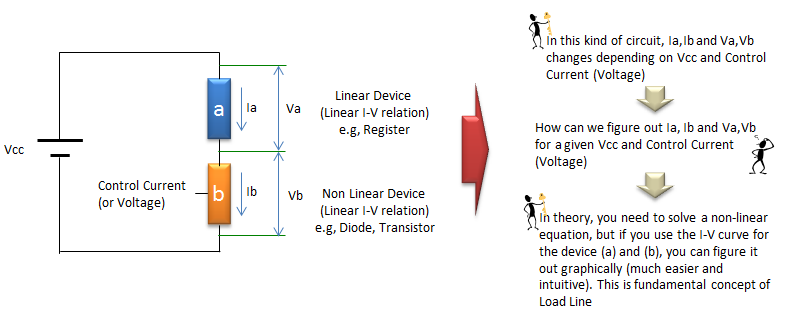
Loadline is a special type of I-V curve showing the characteristics of Load (Linear load in most case) applied to a circuit (Non linear circuit in most case). I think more important point of Loadline is not its definition, but it is application. The meaning of Loadline in real circuit can be illustrated as follows. (b) can be a non-linear device (e.g, Transistor) and (a) can be a load (e.g, a resistor) applied to the device.
Loadline for Diode Circuit
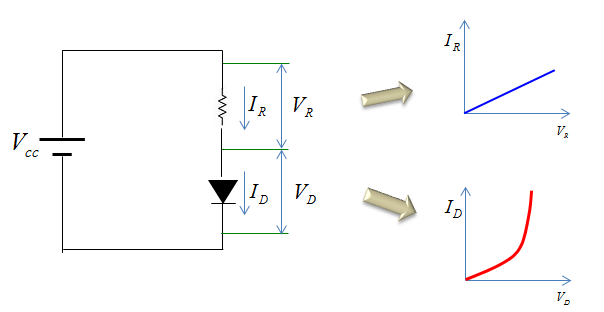
Loadline is mostly applied with Transistor circuit, but for simplicity let's look at the diode case first. Let's assume that we have a circuit as shown on the left. The I-V characteristics of the resistor (Load) and the diode can be represented as shown on the right.
Let's assume that we know the value of Vcc and the the resistance value. and we have question sayinig "What would be the value of the current flowing through the resistor and diode and voltage across the resistor and diode ?".
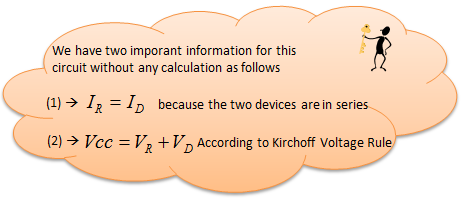
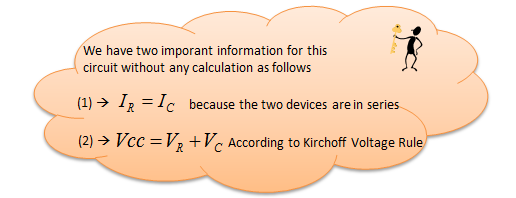
To figure out the answer to this questions, we need to understand very important characteristics of the circuit coming from Kirchoff's current and voltage law. This precondition can be summarized as below.
To get the solution, you may need to solve a non-linear simultaneous equation that sound scary. But with using Loadline graph, you can get the solution of the problems directly from a graph.
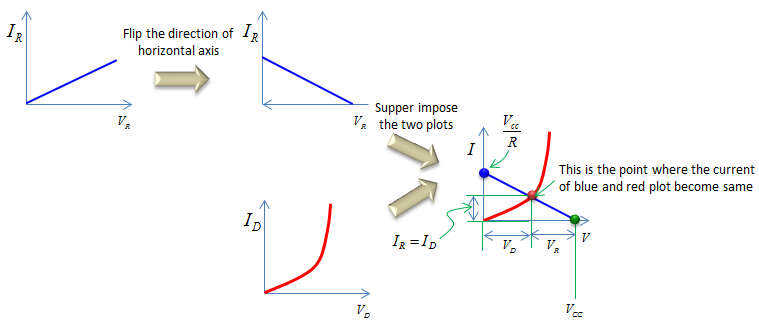
The procedure for the graphical solution is as follows. i) First, flip the I-V graph for the load around vertical axis so that the direction of Voltage become the opposite to the direction of the voltage for the diode. ii) Second, combine (superimpose) the I-V graph of the load and the diode. iii) Find the point where the two I-V graph crosses (meets). If you just read out the value of the voltage and current, it is the solution to the question.
Note : you may ask why we need to flip the load I-V graph. You may understand the reason if you think of the voltage condition of the circuit. As described above, the sum of Voltage accorss the load and the voltage of the diode is always constant (the sum is same as Vcc in this case). It means, if Voltage across load increases, voltage across the diode decreases and in vice versa. So if you flip the load I-V graph around and then combine the two graph and moving a point on horizontal axis will always reflect this property. For example, if you move a point on voltage axis to the right, it means 'increasing the voltage accorss diode and decreasing the voltage around the resistor'. If you move a point on voltage axis to the left, it means 'decreasing the voltage accorss diode and increasing the voltage around the resistor'. This may not sound clear to you, but give some time to think in more detail.
Loadline for Transistor Circuit
Now let's look into a more practical circuit for the load line application. It is a transistor circuit.
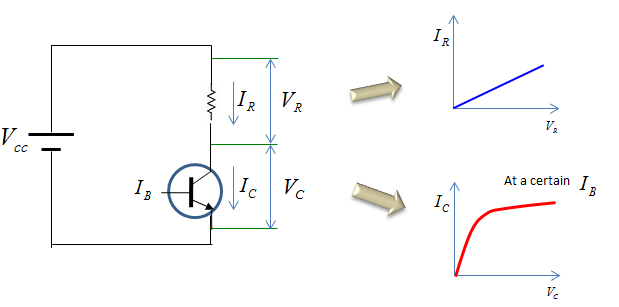
Let's assume that we have a circuit as shown on the left. The I-V characteristics of the resistor (Load) and the transistor can be represented as shown on the right.
Let's assume that we know the value of Vcc and the the resistance value. and we have question sayinig "What would be the value of the current flowing through the resistor and diode and voltage across the resistor and transistor ?".
As shown in previous example, we need to understand very important characteristics of the circuit coming from Kirchoff's current and voltage law. This precondition can be summarized as below.
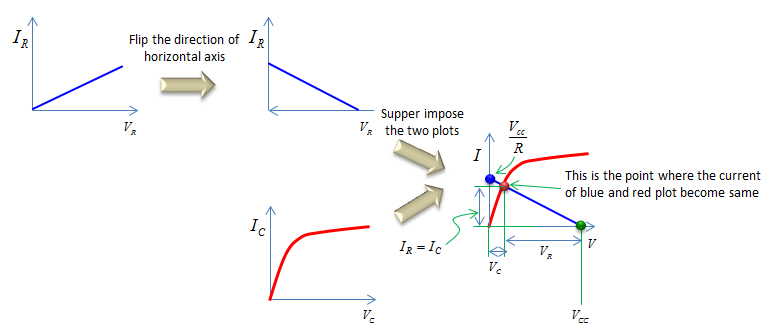
The solution finding procedure using graphical method is same as in previous example. i) First, flip the I-V graph for the load around vertical axis so that the direction of Voltage become the opposite to the direction of the voltage for the transistor. ii) Second, combine (superimpose) the I-V graph of the load and the transistor. iii) Find the point where the two I-V graph crosses (meets). If you just read out the value of the voltage and current, it is the solution to the question.
Before you move to next step, now look at some details of the combined I-V graph. You see the three points. Green points on horizontal axis (Voltage axis) and Blue point on current axis (Current axis). and Red point on crossing point of the I-V curve. As you see, the Green point directly indicate Vcc and Blue point indicate the current following the two device which is calculated from Vcc/R
Intuitive Interpretation of Loadline
Now let's take some practice of interpretting the graph. Main purpose for this practice is to improve your intuition for the graph.
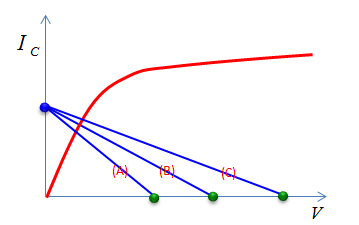
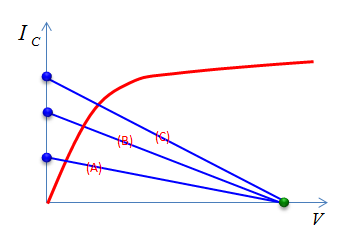
Here goes the first example. In this graph, you see three different blue graph. What is the difference between (A), (B), (C) ? Location of green points (point on Voltage axis) are different. It means that Vcc of the circuit are different. The location of blue points are same. Does it mean that the resistance value of the three graph is same ? The answer is No. The location of blue points is not determined by the resistance only, it is determined by Vcc/R. Since Vcc got different, you should change the resistance accordingly to the location of the blue points stay same.
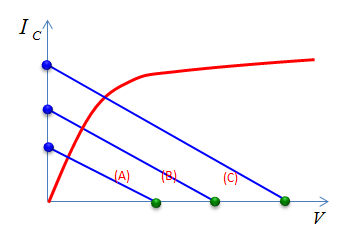
Now goes the second example. In this graph, you see three different blue graph as well. What is the difference between (A), (B), (C) ?
The location of green points are same. It means that Vcc for the three graphs are same. Location of blue points (point on Current axis) are different. It means that the current following the device are different. Does this mean that the resistance values are different ? The answer is Yes. Since the blue point is determined by Vcc/R and Vcc have not changed, R should have been changed to represent these blue graphs.
Now goes the third example. In this graph, you see three different blue graph as well. What is the difference between (A), (B), (C) ?
both location of green points and blue points are different. It means that Vcc for the three graphs are different. Location of blue points (point on current axis) are different. It means that the current following the device are different. Does this mean that the resistance values are different ? The answer is No. Since the blue point is determined by Vcc/R and Vcc have not changed but the slope of the three graph are same (let's assume they are same :)), it means R value has not been changed
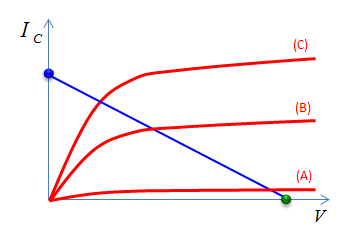
Now goes the fourth example. In this graph, you see three different red graph in this case. Blue graph has not changed. It means that there is no changes in Vcc and R. What is the difference between (A), (B), (C) ? It would not be easy to get the answer to this question if you are not familiar with transistor. Just to give the answer for now, the three different red graph may mean three different Transistor or the same transistor with different control signal level.
|
||