|
Engineering Math - Graph Theory |
|||||||||||||
|
What is Graph ?
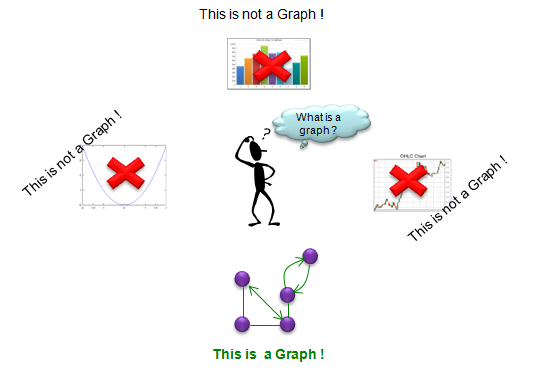
As the name implies, Graph Theory is a branch of mathematics which deals with Graph. Then you may ask what is graph ? If you think about the graph that is like charts as you see in Excel spreadsheet, function plot as you see in middle school or high school math text book or those charts showing stock price changes etc, you are completely on a wrong track. The "graph" in Graph Theory is 'a bunch of dots connected each other with a bunch of lines or arrow"
Then the next question you would have would be "what is the meaning of those dots and lines in a graph ?". Simply put, 'Dot' represents an 'object' or 'entity', 'line' or 'arrow' indicates the relationship between the dots (objects).
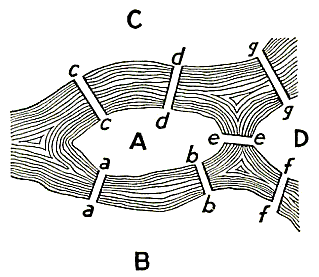
The most famous example of a Graph is from Konigsberg brige as illustrated below. A, B, C, D indicates a town (village) in and around a river. The white path (e.g, c-c, d-d, e-d etc) across the river indicate brigdes across the reiver.
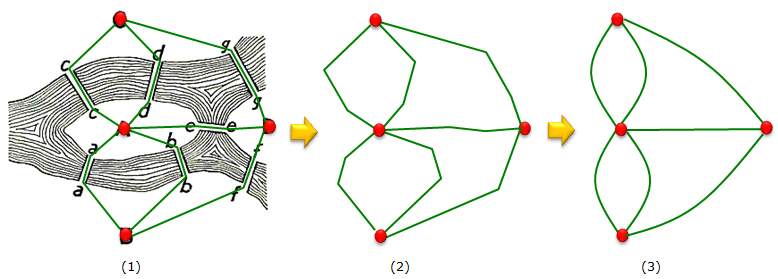
Now let's replace the name of the town (A,B,C,D) with Dots (red dots shown below) and connecting these dots as (1) below. And then let's remove the map in the background in (1) and now you have only dots and connecting lines as shown in (2). If you make the lines a little bit smoother, then you would get a common graph you would see in a textbook. This is how a graph is created.
In forrmal Graph theory, we call the dot as a Vertex and call the line as Edge.
The most important thing in any type of Graph analysis is to clearly define (understand) the meaning of the Vertice and Edges in the graph. This meaning differs in every graph, so you would need a lot of practice of interpreting the meaning of dots and lines in various types of graph.
What is the meaning of the Vertex and Edge of the example shown above ? It is as follows :
Video Digest
|
|||||||||||||


