Recursion or Iteration means "doing the same process over and over". If you represent this expression in mathematical form, it can be expressed as shown below. I hope this make sense to you.
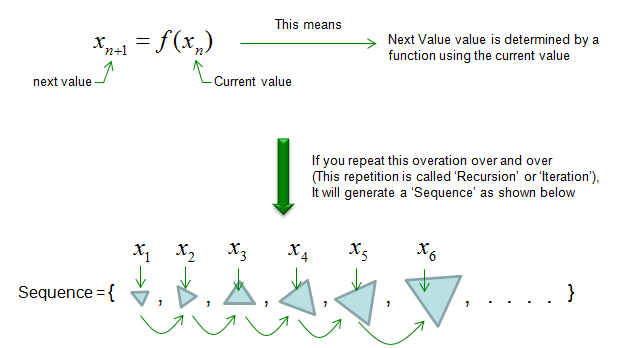
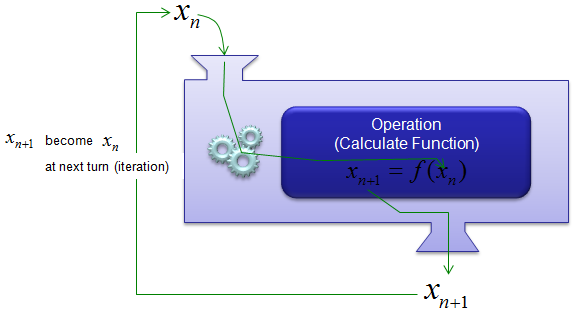
If you illustrate the iterative/recursive process in more intuitive form, you can illustrate it as follows. If we take a function (f(x)) as a machine to generate a product(output) from a raw material (input). In this machine, if you put anything (input = raw material), you would get a product (output). And then you take the output and put it as the input of the machine, you would get another output. And then you take that output and put it as an input. you would get another output. This kind of repeating process is called 'iterative or recursive' process.
Why we care about this kind of process ?
One of the main reason is that the output of even a very simple iterative function generate very complex-looking output. In many cases, when we meet a very complicated things (phenomena), we tend to day "This is too complicated to explain in a certain scientific rule" and give up trying to find rule itself. For example, what would you say if somebody ask you "Look at all the branches of that big tree. Would that be any rules how each of those branches are formed ?. In other words, can you draw anything like those tree using some mathematical procedure ?". or what would you say if you are asked "Look at the spiky rocks, can you draw any similar shap like that using a mathematical procedure ?".
Even until very recently (before we pay attention to 'iterative/recursive' functions), the questions to these questions were ".. It is just natural phenomena.. there is no specific rules .. or the rule is so complicated that we cannot explain in curent scientific method. But now a lot of those complicated phonomina can be explained by sprisingly simple iterative function or iterative process. and the iterative function/process is the foundation of Fractal and Chaos.
The page works in three steps. First, two examples show how a sequence grows out of one rule and one starting value. Then a short test tells you in advance whether an iteration settles to a single value or keeps moving. That test explains why the two examples behave so differently.
- What does an iteration look like with real numbers ?
- When does an iteration settle down, and when does it not ?
What does an iteration look like with real numbers ?
The machine picture above is easier to trust once you have pushed a few numbers through it by hand. The two examples below use the same procedure with different functions. Example 1 is linear, and its sequence grows smoothly. Example 2 adds one nonlinear term, and its sequence becomes irregular. Keep both in mind, because the last section of the page explains the difference.
Example 1
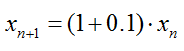
This example illustrates a recursive mathematical relationship where each term in a sequence is calculated based on the previous term using the formula. The important point is that each term depends directly on the previous term in the sequence, which is emphasized in the step-by-step process shown in the diagram. This recursive process ensures that every new term builds upon its predecessor.
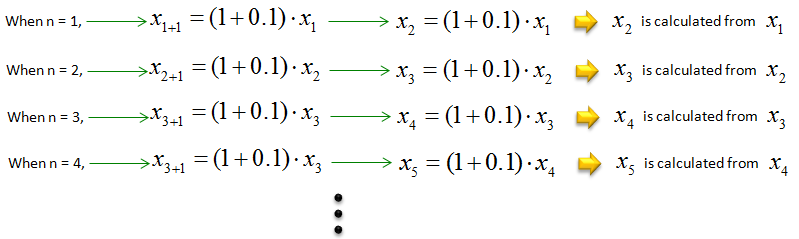
Read the n = 4 row of the diagram above with care. Its middle term shows x3+1 = (1 + 0.1) x3, but it should be x4+1 = (1 + 0.1) x4. The right-hand term of the same row, x5 = (1 + 0.1) x4, is correct. The same slip appears in the two diagrams further down.
Starting with x1 (the initial term of the sequence):
- x2 = (1 + 0.1) x1
- x3 = (1 + 0.1) x2
- x4 = (1 + 0.1) x3
- x5 = (1 + 0.1) x4
This pattern continues iteratively, with xn+1 being derived from multiplying xn by (1 + 0.1) for every subsequent n.
As you see here, if you know the initial condition (x1) you can figure out all of the subsequent numbers (x1,x2,x3,x4 etc) . How can I figure out the initial condition ?
NOTE : In most of the text book, starting point (the initial condition) is represented as x0 but I represented it as x1 because '1' looks more like a 'starting point' than 0. It doesn't matter.. you know the point
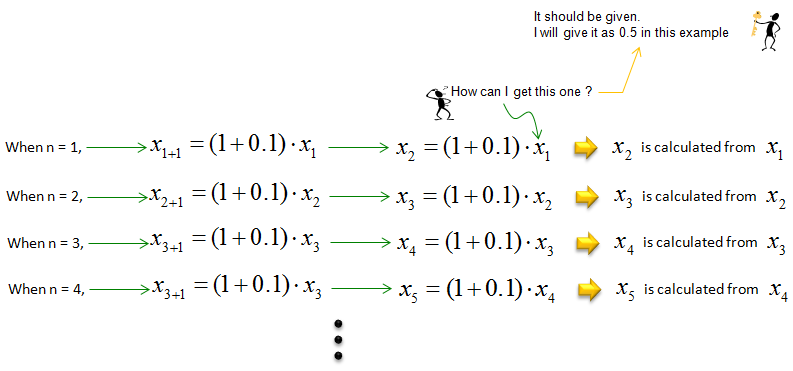
How can I figure out the initial condition ? Simple. I should be given or you just pick any number on your own. You may pick just any arbitrary number just for practice, or you may need to pick the number carefully if this model is associated with a specific real life problem.
Just for practice, let's assume that the initial number x1 is 0.5. Then you can plug this number and calculate the subsequent numbers as follows.
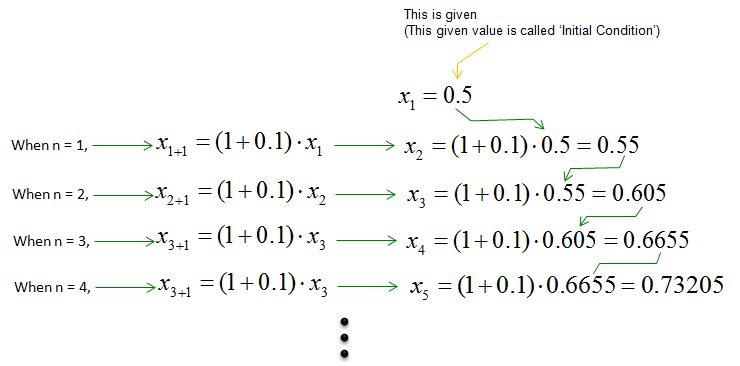
You don't have to iterate step by step in this example. Each step multiplies by the same factor 1.1, so xn = 1.1n-1 x1. With x1 = 0.5, this gives x5 = 0.5 x 1.14 = 0.73205, the same value as the last line above. The sequence grows by 10% at every step, like compound interest. So it doubles roughly every 7.3 steps, because ln 2 / ln 1.1 = 7.27.
A closed form like this exists only for simple rules. For most nonlinear functions, including the one in Example 2, you have to iterate to find xn.
Example 2
This example shows a practical example called 'logistic map equation'. It is one of the most frequently used example when we talk about recursive function. The only change from Example 1 is the factor (1 - xn). That factor makes the rule nonlinear, and it is enough to turn smooth growth into the irregular sequence plotted below.
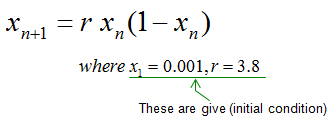
This model is widely used to study population dynamics, where xn might represent the population at time n, r represents the growth rate, and (1 − xn) accounts for limited resources or competition. In this context, the chaotic fluctuations could model unpredictable population changes under certain conditions.
Following is the plotting of xn recursively calculated by the method explained in example 1
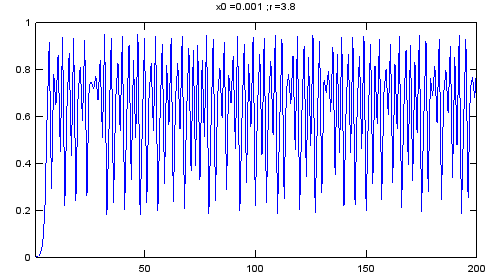
The graph displays the values of xn over successive iterations, starting with x1 = 0.001 and r = 3.8.
The horizontal axis represents the iteration count (n), while the vertical axis represents xn, the value of the sequence at each step.
- Chaotic Behavior:
- The sequence does not settle into a fixed point or periodic behavior but instead fluctuates irregularly.
- This behavior is characteristic of chaotic systems when the parameter r is in a certain range (e.g., r = 3.8 in this case).
- Sensitivity to Initial Conditions:
- The chaotic behavior of the system implies that small changes in the initial conditions (x1) or the parameter r can lead to dramatically different sequences.
- Logistic Map in Chaos Theory:
- At r = 3.8, the system demonstrates one of the key properties of chaotic systems: seemingly random behavior emerging from a deterministic process.
When does an iteration settle down, and when does it not ?
Example 1 grows without limit, and Example 2 jumps around forever. Many other iterations settle to one value. Let's find a test that predicts which of these happens before you run a single iteration. The test uses only the function f and its derivative.
Start with the value where the iteration would stop changing. That is a fixed point x*, a value with f(x*) = x*. If the sequence lands exactly on x*, every later value is x* too. The next question is what happens when the sequence is close to x* but not on it.
Near x*, the function is almost a straight line with slope f'(x*). So a small distance from x* is multiplied by about f'(x*) at every step. This gives a simple rule.
- If |f'(x*)| < 1, the distance shrinks at every step. The fixed point is stable, and a sequence that starts near it converges to it.
- If |f'(x*)| > 1, the distance grows at every step. The fixed point is unstable, and the sequence moves away from it.
- If f'(x*) is negative, the sequence lands on alternate sides of x* at each step. It converges or diverges while oscillating.
Now apply the rule to both examples. In Example 1, f(x) = 1.1x. The only fixed point is x* = 0, and f'(0) = 1.1. So the fixed point is unstable, and any nonzero start grows away from 0. With a factor of 0.9 instead of 1.1, the same sequence would shrink to 0.
In Example 2, f(x) = r x (1 - x) and f'(x) = r (1 - 2x). This function has two fixed points, x* = 0 and x* = 1 - 1/r. At x* = 0 the slope is r, so this point is unstable for any r > 1. At x* = 1 - 1/r the slope is 2 - r. So this fixed point is stable only while 1 < r < 3.
The diagram below makes the rule visible with a cobweb plot. Each plot shows the curve xn+1 = r xn(1 - xn) and the diagonal xn+1 = xn. Each iteration goes vertically to the curve and then horizontally to the diagonal. The fixed point sits where the curve crosses the diagonal. Both plots start from x1 = 0.1 and show 40 iterations.
Figure 1. Cobweb plots of the logistic map. At r = 2.8 the slope at x* is -0.8, so the path spirals into x* = 0.643. At r = 3.8 the slope at x* is -1.8, so the path is pushed away from x* and never settles.
- In the left plot, the path starts at x1 = 0.1, climbs in steps, and then circles the fixed point. Each circle is smaller than the one before it, because the slope there is -0.8.
- In the right plot, the curve is steeper at the crossing point. The path comes near x* but cannot stay, and it fills a band between about 0.18 and 0.95.
- The top of the right curve is r/4 = 0.95, and one more step maps it to 0.18. These two numbers are the upper and lower limits of the plot in Example 2.
Between r = 3 and r = 3.8 there is a middle ground. The fixed point is unstable, but the sequence still settles into a repeating cycle. The table below lists the long-run values for x1 = 0.001 after 10000 iterations.
r |
x* = 1 - 1/r |
f'(x*) = 2 - r |
Long-run behavior |
2.5 |
0.6 |
-0.5 |
Settles to 0.6 |
2.8 |
0.6429 |
-0.8 |
Settles to 0.6429 after a longer oscillation |
3.2 |
0.6875 |
-1.2 |
Period 2 cycle: 0.5130, 0.7995 |
3.5 |
0.7143 |
-1.5 |
Period 4 cycle: 0.3828, 0.8269, 0.5009, 0.8750 |
3.8 |
0.7368 |
-1.8 |
No cycle. The values stay between 0.18 and 0.95 without repeating |
At r = 3.8 the sequence is also very sensitive to its start. Change x1 from 0.001 to 0.0010001, a difference of 0.0000001. By x22 the difference has grown to about 0.1, a factor of a million. A few steps later the two sequences no longer look alike. This is the sensitivity to initial conditions that the Example 2 bullets describe. The average growth rate of a small difference at r = 3.8 is about e0.43 = 1.54 per step. This average, 0.43, is the Lyapunov exponent. A positive value is the usual numerical sign of chaos.
A fixed point is where the iteration would stop : solve f(x*) = x* first. It tells you which value the sequence might settle to.The slope decides stability : |f'(x*)| < 1 pulls the sequence in, and |f'(x*)| > 1 pushes it out. A negative slope adds an oscillation around x*.No stable fixed point does not mean chaos : at r = 3.2 and r = 3.5 the sequence settles into a cycle of 2 or 4 values. Chaos appears only at larger r, such as r = 3.8.The same test works for any one-variable iteration : it needs only f and f'. That makes it the first check to run before a long simulation.