|
Matlab/Octave |
|||||||||||
|
Handling Binary Numbers
Reading Numbers from a Finary file is very simple as shown below. (But you should know how these number is stored in the binary file, otherwise what you read would be a garbage)
fid = fopen('sample.bin','r'); [data,count] = fread(fid, 'single'); fclose(fid); In this example, number of data read from the file is stored in 'count' and all the numbers read is stored in 'data' as a vector. You have to know the number type to specify in number format (in red) in fread(). Followings are the list of format you can specify.
Example 1 : Reading I/Q Data from a Binary File
In this example, I will read a list of I/Q data that has been captured by an equipment (digitizer) which captures RF signal and stores in the form of I/Q data in the following format. Each of the number is 4 byte (32 bit) floating point
Following is my sample code to read this binary data. Before you try this, I would recommend you to check on the size of the file. If the filesize is too big, you may have difficulties to read the whole file at once depending on your PC memory. The file size that I used in this example is around 20 Mb and the number of data stored in the file is around 5.5 million. Also I put the matlab file and the binary data in the same folder otherwise you have specify the full path of the file in fopen().
% By following routine, the whole data are read and stored in the variable 'data' fid = fopen('UL_1_4Mhz_1RB.dgz','r'); [data,count] = fread(fid, 'single'); fclose(fid); % I want to display the data in frequency domain, but I will slice out only a small portions of the data % since the total number of data is too big. ChunkStart = 1; ChunkLength = 54600*1;
DataChunk = data(ChunkStart:ChunkStart+ChunkLength-1);
% Now I will separate I value and Q value and save them into separate variable. DataChunkI = DataChunk(1:2:length(DataChunk)); DataChunkQ = DataChunk(2:2:length(DataChunk));
% I will combine the I data and Q data into an array of Complex Number DataChunkComplex = DataChunkI + j*DataChunkQ;
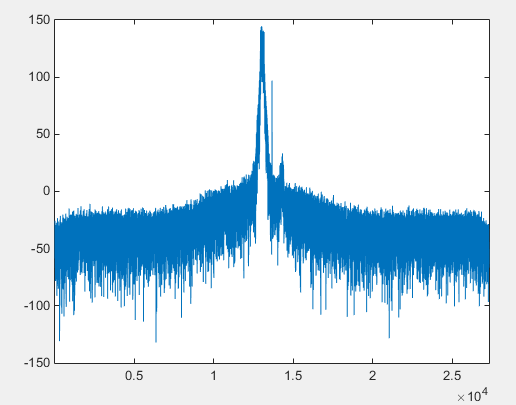
% Do FFT and plot it in dB scale. DataChunkFFT = fftshift(fft(DataChunkComplex)); DataChunkFftdB = 20*log(abs(DataChunkFFT));
plot(DataChunkFftdB);xlim([1, length(DataChunkFftdB)]);
Following is the out of this code.
|
|||||||||||
