|
RF |
||
|
EM Wave Polarization
Polarization has many different meaning in various context. So it would be hard to find the simple and well described described (try to google 'Polarization' and see if it helps). To me, I think the following one sentence from Wikipedia sounds simple and well desribed. The polarization of an antenna refers to the orientation of the electric field (E-plane) of the radio wave with respect to the Earth's surface Especially the green part is the statement that may apply to almost everything in this page. 'with respect to the Earth's surface' would better be changed to 'in 3D cartesian coordinate' to make it better fit for the description in this page.
The Wikipedia shows a couple of very intuitive animation. However, in many cases especially at a very early stage of learning curve, the animation would cheat you to think that you understand it (but in reality it is not) mainly because the animiation does not give your brain enough time to think of the concept. However, the animation would be helpful to trigger various questions in your mind at early stage of learning, and helpful to confirm on your understanding after you studied enough.
So my personal approach is i) If available, search and look into some short video clips and animations.. have some of your own questions. ii) search for various of written descriptions with static image or figures / plots, and spend enough time for you to understand or at least get familiar with iii) go back to the animation at step i). The animation would look very differently One of the problems of written descriptions at step ii) would be that those material tend to give you only a few image, graphs/figures but does not give such a diverse cases of image / graphs. My note is also only one example for step ii). This page would not be enough to give you a complete understanding. But I hope my note here would give you at least some portions of understanding and help you to better understand other materials that you may search further.
To help you further and to help myself as well, I wrote two Python script to draw all the plots in this page and animate these plots. I strongly recommand you to try chaning the parameter values in the script on your own. Have Fun !!!
Sorry for too long prelude. Now getting down to the topic.
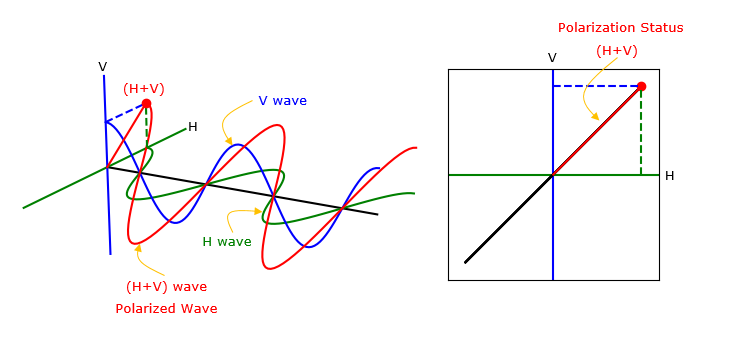
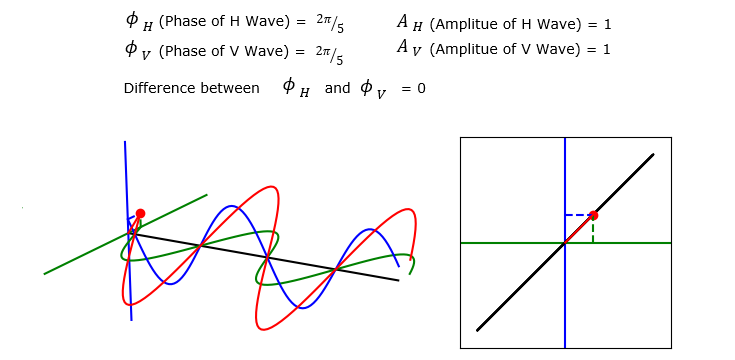
Let's assume that you have two dipole antenna labelled as V (Blue) and H (Green). The electric field of V (Blue) is oscillating as in Blue sinusoidal plot. The direction of oscillation is aligned to the vertical axis of the coordinate system, we would say 'Blue wave is vertically polarized'. The electric field of H (Blue) is oscillating as in Green sinusoidal plot. The direction of oscillation is aligned to the horizontal axis of the coordinate system, we would say 'Blue wave is Horizontally polarized'. However, if you are standing far away from these two antenna and feels for the radiating field, you would feel the summed energy of the two polarized and you will feel a wave polarized in a new pattern as in Red sinusoidal plot. If you observe the summed field in Red projected onto V and H plane, you will see a trajectory as shown in the plot on the right side. The main purpose this page is the pattern (trajectory) of this page is to see how the summed wave(Red plot on the left) and the pattern on the right depending on various parameters of V and H wave.
Mathematical Representation of Polarization
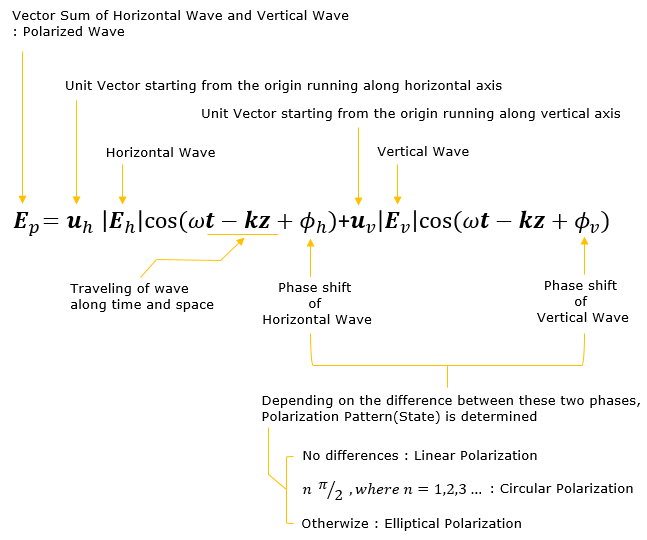
The illustration shown above can be represented in mathematical equation as shown below. The Red curve is represented by Ep and the Green curve is represented by the first term on the right hand side. The blue curve is represented by the second term on the right hand side.
Linear Polarization
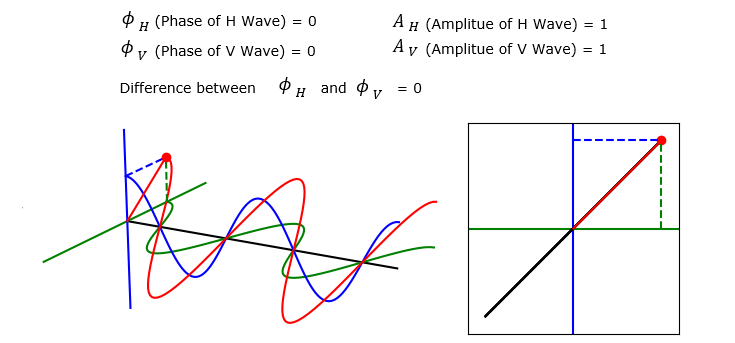
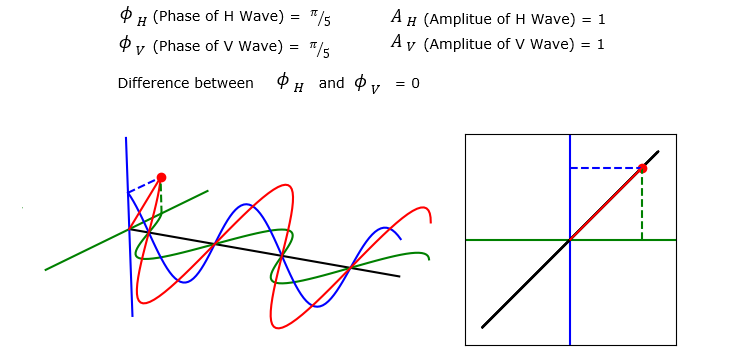
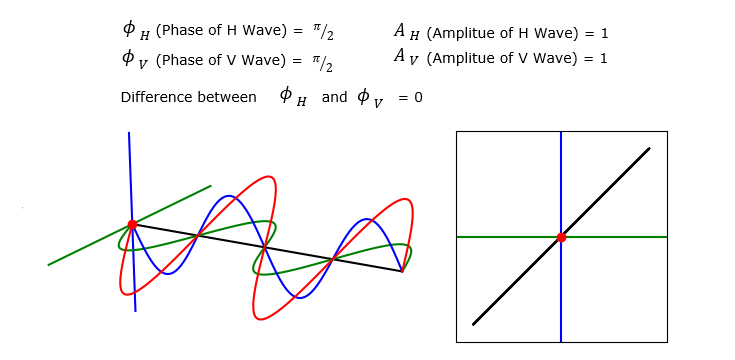
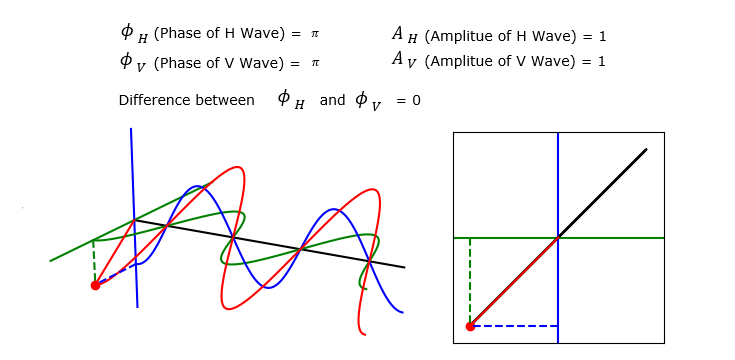
In this section, I will show you several examples of the V, H propagation and the summed wave. Each of these example will is plotted by applying different set of parameter values. But you will notice that the trajectory shown on the right (Polarization pattern)all of these example are all straight line (i.e, linear). That is, the summed wave in all the example in this section has linear polarization.
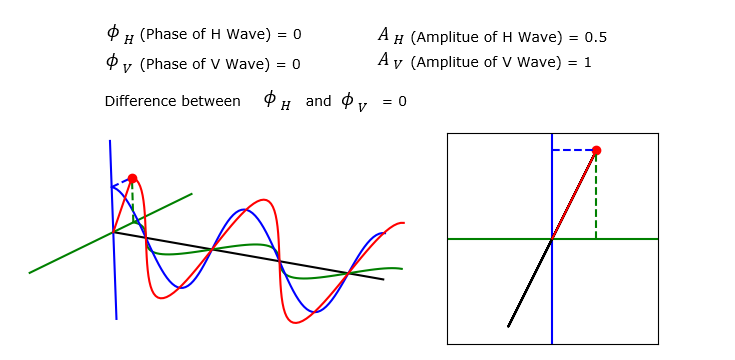
Now let's suppose a case where the Amplitue of H and V wave is different. You still see that the summed wave shows linear polarization since the phase of V and H are still same. But the angle of polarization changes.
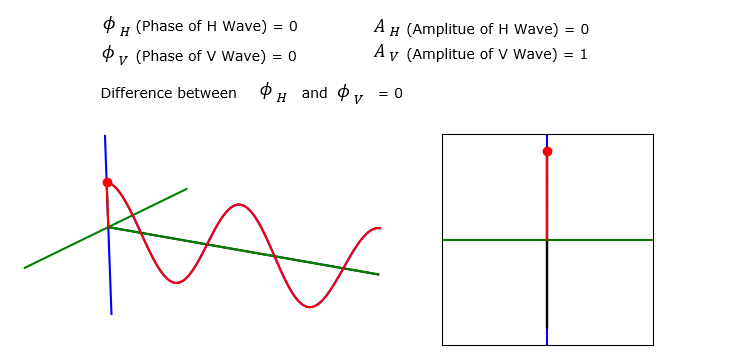
As an extreme case, let's set the amplitude of H wave (i.e, turnning off H wave). Then you see the summed wave superimpose (overlap) onto V wave.
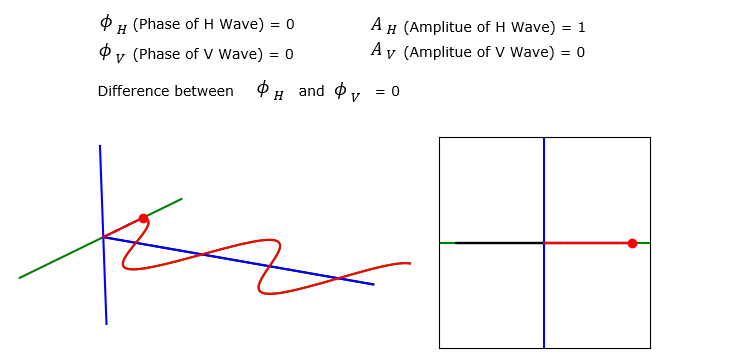
As another extreme case, let's set the amplitude of V wave (i.e, turnning off V wave). Then you see the summed wave superimpose (overlap) onto H wave.
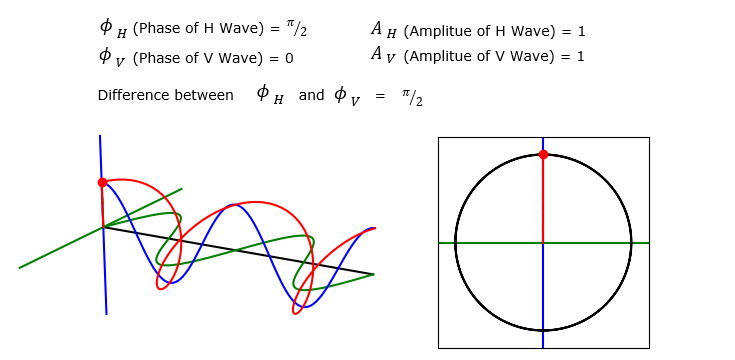
Circular Polarization
Now let's try to set the phase difference between H and V to be pi/2 (90 degree) and see how the summed wave(Red) and polarization pattern changes. The result is as shown below. As you see on the trajectory on the right side is perfect circle. This type of polarization is called Circular Polarization.
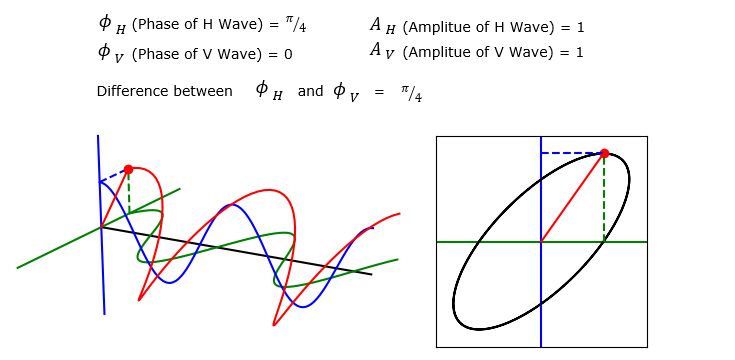
Elliptic Polarization
Now let's try to set the phase difference between H and V to be different by some value other than pi/2 and see how the summed wave(Red) and polarization pattern changes. The result is as shown below. As you see on the trajectory on the right side is elliptic. This type of polarization is called Elliptic Polarization.
Reference :
|
||