Every RF component delays the signal that goes through it, and that delay is usually not the same at every frequency. Group Delay is the number that tells you how the delay changes across the band. I'll start with what Group Delay is and how it is defined. Then we go through the typical shapes of phase over frequency, and finish with why a Group Delay variation distorts a modulated signal.
- What is Group Delay ?
- How is Group Delay defined ?
- What shapes can the phase over frequency take ?
- Why does a Group Delay variation distort the signal ?
What is Group Delay ?
Let's start with the phase of a wave, because Group Delay is built from it. A wave that goes through a filter, an amplifier or a cable comes out later than it went in. In the frequency domain, that delay appears as a phase shift.
Group Delay is an indicator that represents how much phase delay of wave occurs over frequency while it is going through a component. As a wave goes through any component, a certain degree of phase delay happens and in addition the degree of the phase delay in most case varies depending on the frequency of the wave.
In a device which operate within narrow frequency range, the Group Delay may not matter much, but in most wide band device like wideband Filters, it is important to keep the Group Delay within a certain value.
Large Group Delay may not cause much issue in terms of energy (power) transfer across the device, but it would cause serious signal distortion and this becomes more serious issue in a wireless digital communication which is using higher order modulation and even more problem in the system which uses OFDM.
Let's put the two effects side by side. The magnitude of S21 over frequency describes the power transfer of a component, and you read the insertion loss from it. The phase of S21 over frequency describes the delay, and Group Delay comes from it. A filter can have a flat magnitude in its passband and still have a phase that bends near the band edges. So the filter passes the correct power but delivers a distorted waveform. You see this problem only when you look at the phase.
Group Delay comes from the phase response : it describes how the phase shift of a component changes with frequency.Group Delay is separate from insertion loss : a component can have a low loss and still have a large Group Delay variation.Wideband components need a Group Delay limit : a wider band gives the phase more room to bend.Higher order modulation is more sensitive to it : its constellation points are closer, so a smaller distortion already causes a symbol error.
How is Group Delay defined ?
The formula is short, but it comes in two forms with two sets of units. So let's check both forms before we use them. The picture below also works out the unit, and the unit shows that Group Delay is a time.
Probably the definition in mathematical form would look clearer since the mathematical expression is very simple as shown below. Be aware that 'Delay' and 'Group Delay' is different.
The picture below writes Group Delay as minus the derivative of the phase shift with respect to frequency. The upper line uses the phase in radians and the frequency in radians per second. The lower line uses the phase in degrees and the frequency in Hz. On the right, the units of the upper line are divided out, and only seconds remain.
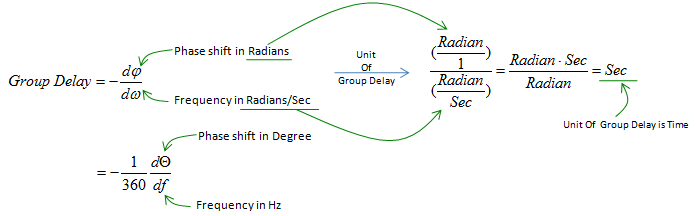
Figure 1. Definition of Group Delay. Both forms give the same value in seconds, because one cycle is 2π radians or 360 degrees.
- The minus sign makes Group Delay positive for a component that delays the signal. The phase of a delayed wave becomes more negative as the frequency goes up.
- The factor 1/360 in the lower line comes from the two unit changes. The phase in radians is π/180 times the phase in degrees, and ω is 2π times f. Together they give 1/360.
- The unit on the right is radian divided by radian per second, which leaves seconds. So Group Delay is a time, even though it is computed from a phase.
Let's check the formula with a pure time delay of 5 ns, for example a short piece of cable. A delay of T seconds shifts the phase by -360 x f x T degrees. With T = 5 ns, the phase changes by -1.8 deg for every 1 MHz. Now put this slope into the lower line. The result is -1/360 x (-1.8 deg / 1 MHz), which is 5 ns. So the formula returns the delay of the cable, and it returns the same value at every frequency.
Now let's come back to the warning above the picture, that 'Delay' and 'Group Delay' are different. The delay of a single sine wave is the phase delay, -φ/ω, and it uses the phase itself. Group Delay, -dφ/dω, uses the slope of the phase. The two values are equal only when the phase is a straight line through zero, as in the cable example. For example, a phase shift that is the same at every frequency gives a phase delay that is not zero. But its Group Delay is zero, because the slope is zero. The name comes from a group of frequencies that travel together, such as the envelope of a modulated signal. The envelope arrives after the Group Delay, while the carrier phase follows the phase delay.
Group Delay is the slope of the phase, with a minus sign : τg = -dφ/dω, with φ in radians and ω in radians per second.In degrees and Hz, the slope is divided by 360 : a slope of -1.8 deg per MHz is a Group Delay of 5 ns.Phase delay and Group Delay are different quantities : they match only when the phase is a straight line through zero.The envelope of a modulated signal travels with the Group Delay : this is why Group Delay, and not phase delay, decides how the data is distorted.
What shapes can the phase over frequency take ?
The definition is easier to use when you see it on a plot. The three plots below show three shapes of phase over frequency, from an ideal case to a realistic one. Each shape leads to a different kind of Group Delay.
We can think of a couple of possible Group Delay patterns as follows. Horizontal axis represents frequency and vertical axis represents phase (Delay just with a negative sign to make it fit to the definition of Group Delay in mathematical form).
In following case, you see some None-Zero phase (delay) value but the value is same across all frequency range. It means 'phase change over frequency change' is zero and in turn, it means Group Delay is zero. This is a kind of imaginary case, you would not see this kind of plot in real device.
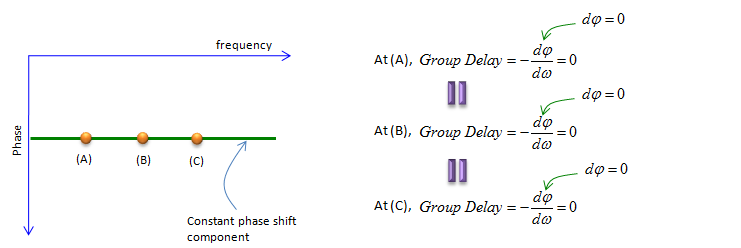
Figure 2. Constant phase over frequency. The slope is zero, so the Group Delay is zero at (A), (B) and (C).
- The green line is the phase. It sits below zero, so the component shifts the phase, but the line is flat.
- At each of the points (A), (B) and (C), dφ is zero. So the formula on the right gives a Group Delay of zero at all three points.
In following case, you see Phase continually changes as frequency changes. But the changing pattern is linear so the 'phase change over frequency' is a constant. It means Group Delay is constant.
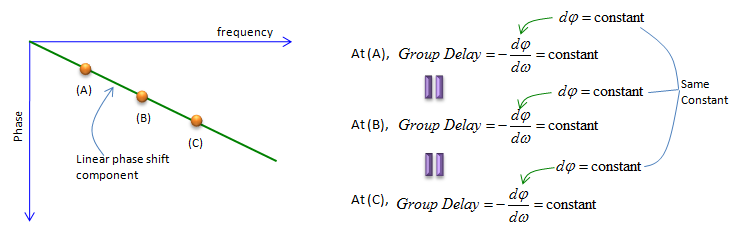
Figure 3. Linear phase over frequency. The slope is the same everywhere, so the Group Delay is the same constant at (A), (B) and (C).
- The label "Linear phase shift component" points to a straight line that moves away from zero as the frequency rises.
- The note "Same Constant" on the right joins the three values of dφ. Each dφ is taken over the same dω, so the Group Delay is equal at the three points.
- The pure 5 ns delay in the example above has this shape. The whole signal arrives later, but every frequency arrives at the same time as every other frequency.
Following case would be the most realistic case. Phase keep chainging over Frequency and the rate of phase change over frequency (Group Delay) also changes over frequency.
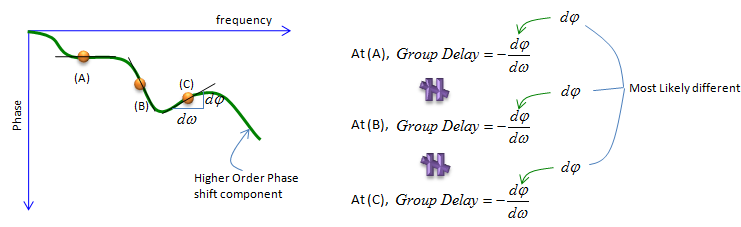
Figure 4. Phase with higher order components. The slope differs from point to point, so the Group Delay changes over frequency.
- The curve is nearly flat around (A) and steep around (B). So the Group Delay is small at (A) and large at (B).
- The small triangle at (C) shows dφ and dω as the two sides of the slope at that point.
- The note "Most Likely different" on the right says that the three values of dφ differ, so the three Group Delay values differ too.
Let's connect the three cases. Figure 2 and Figure 3 both have a constant Group Delay, zero in one case and a fixed value in the other. A constant Group Delay only moves the whole signal in time, and the receiver removes that with its timing. Figure 4 is different. Its Group Delay changes across the band, so different parts of the spectrum arrive at different times. In a real bandpass filter the phase usually bends most near the band edges, so the Group Delay usually peaks there. The next section explains why this variation matters.
A flat phase gives zero Group Delay : the phase can be shifted, but its slope is zero.A linear phase gives a constant Group Delay : the signal is delayed, but its shape is kept.A curved phase gives a Group Delay that changes over frequency : this is the case that distorts the signal.The variation matters more than the value : a filter specification therefore usually limits the Group Delay variation across the passband.
Why does a Group Delay variation distort the signal ?
A modulated signal occupies a band of frequencies, not a single frequency. So we need to ask what happens when the parts of that band are delayed by different amounts. The answer explains the remark above about higher order modulation and OFDM.
Let's take a simple model first, a single pole RC low pass filter. Its phase is -arctan(ωRC), and its Group Delay works out to RC / (1 + (ωRC)2). At DC the Group Delay is RC. At the corner frequency, where ωRC = 1, it drops to RC/2. For example, with RC = 1 microsecond the corner is at about 159 kHz. A signal that spans from DC to the corner then sees its lowest frequencies delayed by 1 microsecond and its upper edge delayed by 0.5 microseconds. So even this simple filter has a Group Delay variation of 0.5 microseconds across its passband.
In a single carrier system, each symbol is a pulse in time. When the frequency components of the pulse arrive at different times, the pulse spreads out. The tail of one symbol then overlaps the next symbol, and this is intersymbol interference. With QPSK the decision regions are large, so a small overlap does no harm. With 64QAM or 256QAM the constellation points are much closer, so the same overlap can move a point into the wrong region. You see this effect as a higher EVM.
In an OFDM system, each subcarrier is narrow, so the effect looks different. A Group Delay variation gives each subcarrier a different phase rotation, and it spreads the impulse response of the channel in time. The receiver estimates the channel from the reference signals and removes the rotation on each subcarrier. But this correction works only under two conditions. The phase must change slowly compared with the spacing of the reference signals, and the total spread of the impulse response must stay inside the cyclic prefix. For LTE with the normal cyclic prefix, the CP of most OFDM symbols is 144 Ts, which is about 4.69 microseconds. The radio channel itself uses part of that time. So the filters in the transmitter and the receiver must keep their Group Delay variation small, especially near the band edges where the outer subcarriers sit.
Let's finish with how the value is measured. A network analyzer measures the phase of S21 at many frequencies. It then computes the slope over a small frequency step, called the aperture. For example, a phase that falls by 36 deg over an aperture of 1 MHz gives 36 / (360 x 1 MHz), which is 100 ns. A wide aperture smooths the curve. A narrow aperture shows more ripple, but it also shows more noise. So before you compare two Group Delay plots, check that both use the same aperture.
A modulated signal occupies a band : each part of the band travels with the Group Delay at its own frequency.A single pole RC filter already shows the effect : its Group Delay falls from RC at DC to RC/2 at the corner frequency.Group Delay variation spreads a single carrier symbol in time : the result is intersymbol interference and a higher EVM.OFDM turns the problem into a phase rotation per subcarrier : the cyclic prefix and the reference signal spacing limit what the equalizer can correct.The measured value depends on the aperture : compare two plots only when they use the same aperture.