RF engineers look at the same signal in two ways. An oscilloscope shows how the signal changes over time, and a spectrum analyzer shows which frequencies it contains. This page explains what the word Domain means, shows a few signals in both domains, and then shows the rule that links the two views.
What does Domain mean ?
Everybody would know what is meant by "Time" and what it meant by "Frequency" in engineering. Then what does it mean by "Domain". Domain is a concept you might have learned in high school math. You would have learned in "Function" section. When you describe a function in terms of 'set' concept, you normally express it as shown in the left side of the illustration below. When the set A is mapped to the set B by a function. The set A is called a Domain and the set B is called Region. When you express a function in the form of graph, the horizontal axis (independent variable) is called "Domain" and the vertical axis (dependent variable) is called "Region".
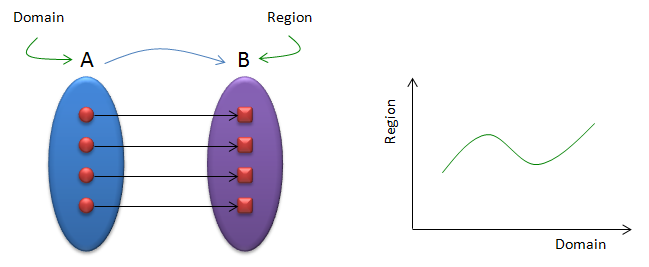
A function maps each point of the Domain to one point of the other set. On a graph, the Domain is the horizontal axis.
- On the left, each red dot in set A has exactly one arrow to a red square in set B. Exactly one output for each input is what makes the mapping a function.
- On the right, the same idea is drawn as a curve. Domain is the horizontal axis label, and Region is the vertical axis label.
- Most math books call set B the range or the codomain of the function. The drawing and this page use the word Region for it.
With this concept in mind, you can easily guess that "Time Domain" means that "Time" becomes the Domain of a plot (independent variable) and "Frequency Domain" means that "Frequency" becomes the Domain of a plot (independent variable)
The vertical axis changes with the domain as well. In the time domain it is usually a voltage or an amplitude at each instant. In the frequency domain it is usually a power, in dBm on a spectrum analyzer, at each frequency. So the two plots of one signal do not share either axis, and that is why they look so different.
Domain is the independent variable : it is the horizontal axis of the plot, time in one case and frequency in the other.The signal is the same in both views : only the variable used to describe it changes.
How does a signal look in each domain ?
Some signals are easier to read in one domain than in the other. A pure tone is a long wave in time but a single line in frequency. A short pulse is simple in time but wide in frequency. The examples below put each signal side by side in both views, so you can match the features.
We can express a signal either in Time Domain or in Frequency Domain depending on which aspect of the signal you want to focus on. Following is a couple of examples of expressing a signal both in Time Domain and Frequency Domain.
The image below uses sine waves. A single sine wave has one frequency, so its spectrum is one line. The position of the line tells you how fast the wave repeats.
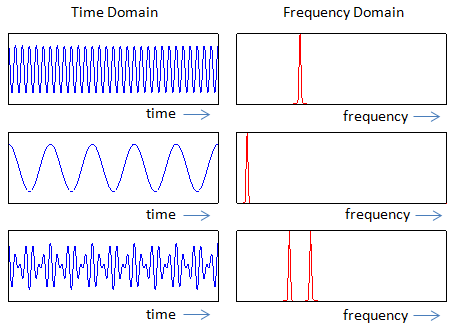
Three periodic signals. Each sine wave becomes a single line, and a sum of sine waves becomes a set of lines.
- Top row: a fast sine wave in time. Its spectrum is one line far to the right on the frequency axis.
- Middle row: a slow sine wave. Its line sits close to zero frequency.
- Bottom row: the envelope of the time signal rises and falls. The spectrum shows two lines close together. Two tones that are close in frequency produce this beat pattern, and the beat repeats at the difference of the two frequencies.
The image below uses pulses. A pulse lasts a short time, so its energy spreads over a band of frequencies instead of one line.
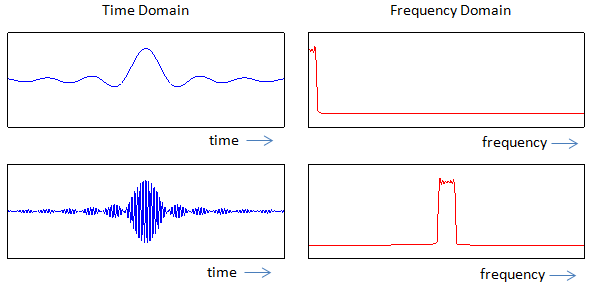
A sinc shaped pulse has a flat, band limited spectrum. Putting it on a carrier moves that band up to the carrier frequency.
- Top row: a sinc shaped pulse with a main lobe and decaying side lobes. Its spectrum is flat from zero frequency up to a sharp edge.
- Bottom row: the same pulse shape carried on a high frequency sine wave. The spectrum keeps the same flat shape but now sits around the carrier.
- The bottom row is what a radio transmitter does. The information sets the shape of the band, and the carrier sets where the band sits.
A pure tone is one line : its frequency sets the position of the line, and its amplitude sets the height.A sum of tones is a set of lines : a beat in the time domain is two close lines in the frequency domain.Modulation moves the spectrum : the carrier shifts the band without changing its shape.
How are the two domains linked ?
The two views are not independent drawings. The Fourier transform converts the time domain signal into its frequency domain form, and the inverse transform converts it back. No information is lost in either direction. So any feature you see in one domain has a matching feature in the other.
The most useful match is between duration and bandwidth. They trade against each other. The sinc pulse above shows it. A sinc pulse whose zero crossings are T apart has a flat spectrum that ends at 1/(2T). For example, with T = 1 ms, the spectrum ends at 500 Hz. Make the pulse twice as short, and the spectrum becomes twice as wide. The same rule works in reverse: a rectangular pulse in time gives a sinc shape in frequency.
OFDM uses the reverse case directly. An LTE OFDM symbol lasts 1/15 kHz = 66.7 microseconds without the cyclic prefix. That rectangular window gives each subcarrier a sinc shaped spectrum with nulls every 15 kHz. The subcarriers are spaced 15 kHz apart, so each one peaks at the nulls of all the others. This is the orthogonality of OFDM, and it is easiest to see in the frequency domain.
The choice of instrument follows the same logic. An oscilloscope shows the time domain, so it suits pulse shape, rise time and timing. A spectrum analyzer shows the frequency domain, so it suits harmonics, spurs, ACLR and occupied bandwidth. A signal analyzer with an FFT can show both from the same capture.
The Fourier transform links the two views : each domain holds the full signal, so you can always convert one into the other.Short in time means wide in frequency : halving the pulse length doubles the bandwidth.OFDM relies on this pairing : a 66.7 microsecond symbol puts sinc nulls every 15 kHz, which is the LTE subcarrier spacing.Pick the domain that makes the question simple : timing questions go to the time domain, and emission questions go to the frequency domain.