|
< Code 1 >
import os
import numpy as np
import matplotlib.pyplot as plt
import mpl_toolkits.mplot3d.axes3d as axes3d
import matplotlib.gridspec as gridspec
def drawAxis(ax,max = 4*np.pi) :
ax.plot([0,max],[0,0],[0,0],'k')
ax.plot([0,0],[-2,2],[0,0],'g')
ax.plot([0,0],[0,0],[-2,2],'b')
return
def drawHwave(ax,max = 4*np.pi, offset = 0, Hshift = 0, Hamp = 1.0):
#t = np.linspace(0 + offset, max + offset, 100)
#x = t - offset
t = np.linspace(-offset, max, 100)
x = t + offset
y = Hamp * np.cos(t - Hshift)
z = 0 * t
ax.plot(x, y, z,'g')
return
def drawVwave(ax,max = 4*np.pi, offset = 0, Vshift = 0, Vamp = 1.0):
#t = np.linspace(0 + offset, max + offset, 100)
t = np.linspace(-offset, max, 100)
x = t + offset
y = 0 * t
z = Vamp * np.cos(t - Vshift)
ax.plot(x, y, z,'b')
return
def drawSumwave(ax,max = 4*np.pi, offset = 0, Hshift = 0, Vshift = 0, Hamp = 1.0, Vamp = 1.0):
t = np.linspace(-offset, max, 100)
x = t + offset
yH = 0 * t
yV = Hamp * np.cos(t - Hshift)
zH = 0 * t
zV = Vamp * np.cos(t - Vshift)
#y = yH + yV
#z = zH + zV
y = yV
z = zV
ax.plot(x, y, z,'r')
return
def drawVectorSum(ax, offset = 0, Hshift = 0, Vshift = 0 , Hamp = 1.0, Vamp = 1.0):
t = -offset
yH = 0 * t
yV = Hamp * np.cos(t - Hshift)
zH = 0 * t
zV = Vamp * np.cos(t - Vshift)
#y = yH + yV
#z = zH + zV
y = yV
z = zV
x1 = 0
y1 = y
z1 = 0
x2 = 0
y2 = y
z2 = z
ax.plot([x1,x2], [y1,y2], [z1,z2],'g--')
x1 = 0
y1 = 0
z1 = z
x2 = 0
y2 = y
z2 = z
ax.plot([x1,x2], [y1,y2], [z1,z2],'b--')
x1 = 0
y1 = 0
z1 = 0
x2 = 0
y2 = y
z2 = z
ax.plot([x1,x2], [y1,y2], [z1,z2],'r')
ax.plot([x2,x2],[y2,y2],[z2,z2],'ro')
return
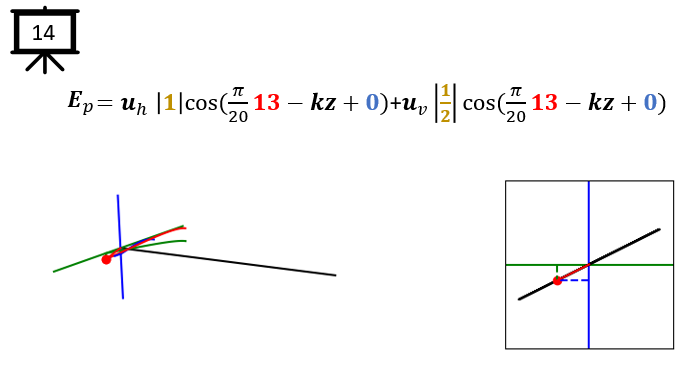
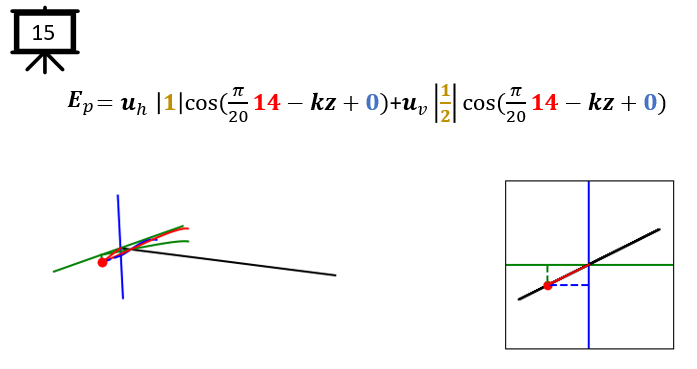
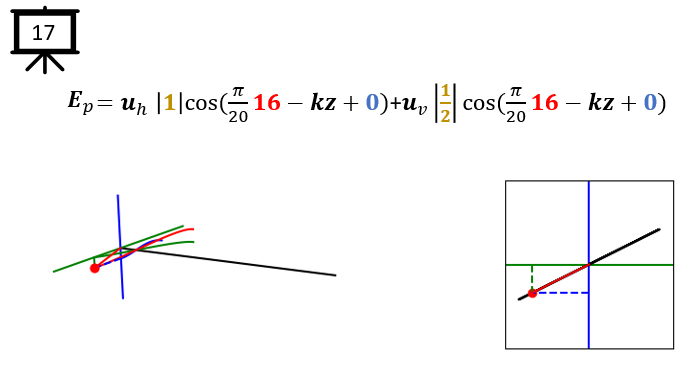
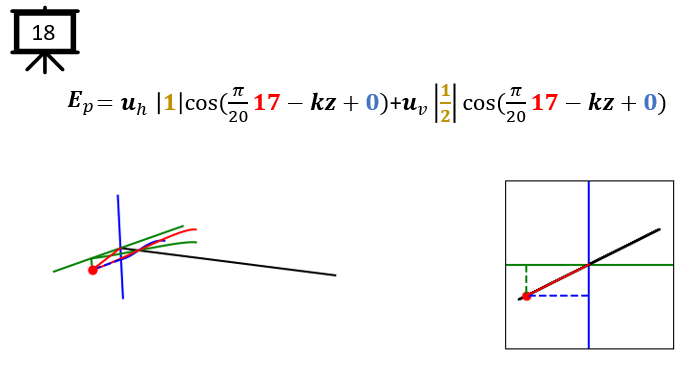
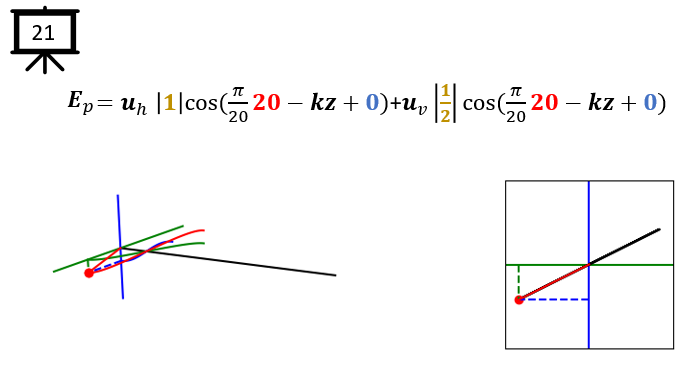
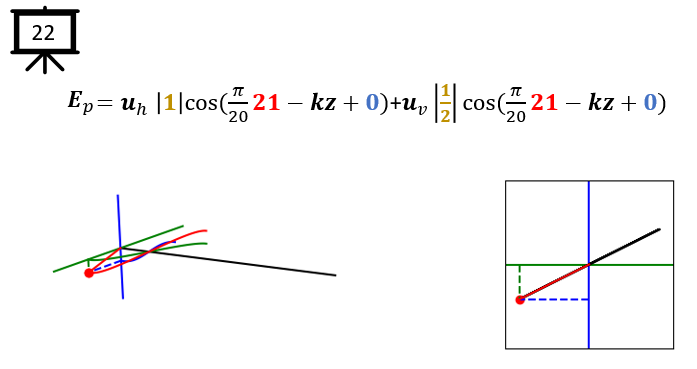
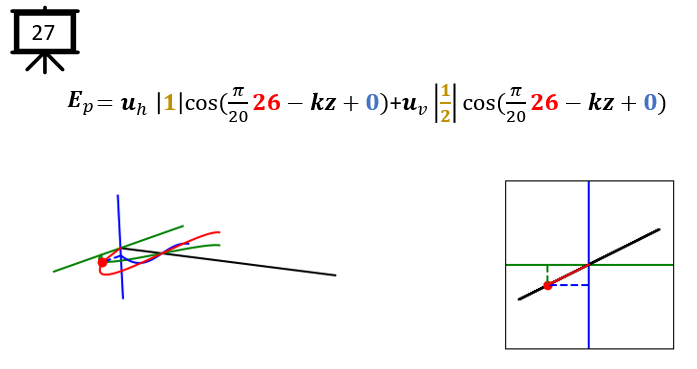
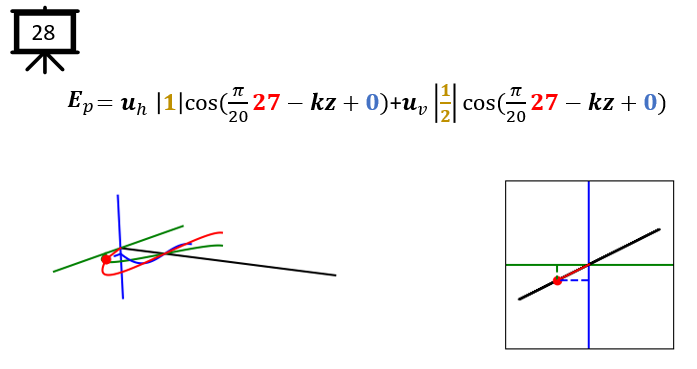
def drawPropagatingWave(ax,off = 0,Hoffset = 0, Voffset = 0, Ha = 1.0, Va = 1.0, plotMax = 4*np.pi):
drawAxis(ax, max = 4*np.pi)
drawHwave(ax, max = plotMax , offset = off,Hshift = Hoffset, Hamp = Ha)
drawVwave(ax, max = plotMax, offset = off,Vshift = Voffset, Vamp = Va)
drawSumwave(ax, max = plotMax, offset = off, Hshift = Hoffset, Vshift = Voffset,
Hamp = Ha, Vamp = Va)
drawVectorSum(ax, offset = off,Hshift = Hoffset, Vshift = Voffset, Hamp = Ha, Vamp = Va)
ax.grid(False)
ax.axis('off')
ax.set_xticks([])
ax.set_yticks([])
ax.set_zticks([])
return
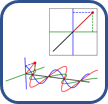
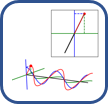
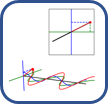
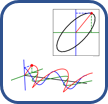
def drawPhaseDiagram(ax,max = 2*np.pi, offset = 0, Hoffset = 0, Voffset = 0, Ha = 1.0, Va = 1.0):
xmax = 1.2
ymax = 1.2
ax.plot([-xmax,xmax],[0,0],'g')
ax.plot([0,0],[-ymax,ymax],'b')
t = np.linspace(-offset, max, 100)
x = Ha * np.cos(t-Hoffset)
y = Va * np.cos(t-Voffset)
ax.plot(x,y,'k')
t = -offset
x = Ha * np.cos(t-Hoffset)
y = Va * np.cos(t-Voffset)
ax.plot(x,y,'ro')
ax.plot([x,x],[0,y],'g--')
ax.plot([0,x],[y,y],'b--')
ax.plot([0,x],[0,y],'r')
ax.set_xlim(-xmax,xmax)
ax.set_ylim(-ymax,ymax)
ax.set_aspect('equal')
ax.grid(False)
ax.set_xticks([])
ax.set_yticks([])
return
fig = plt.figure(figsize=(8,3))
gs = gridspec.GridSpec(1, 2, width_ratios=[3, 1], left=-0.02, wspace=0.1)
ax1 = plt.subplot(gs[0],projection='3d')
ax2 = plt.subplot(gs[1])
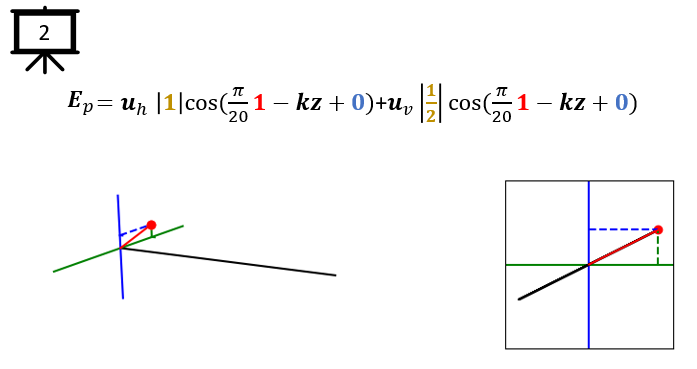
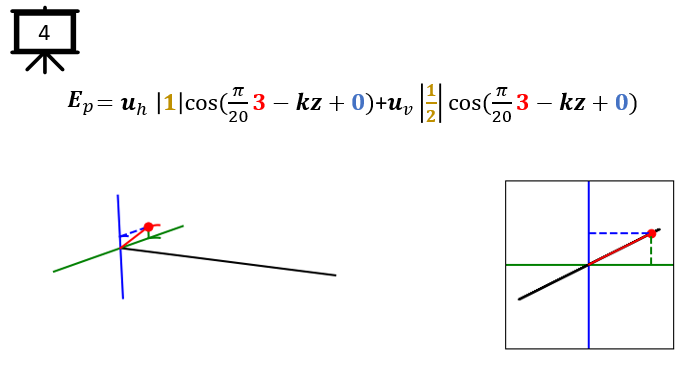
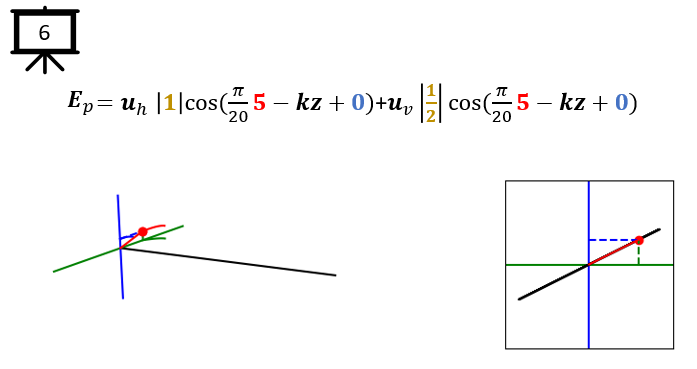
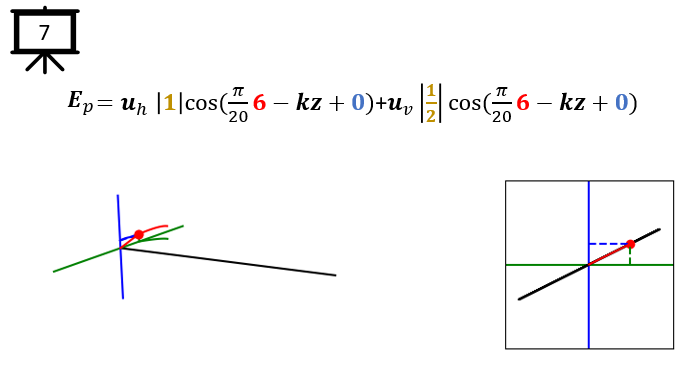
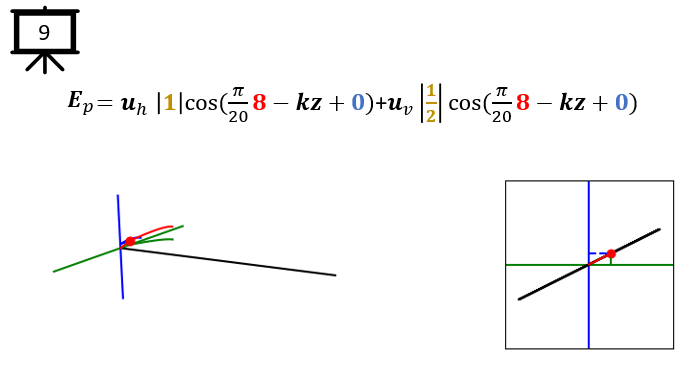
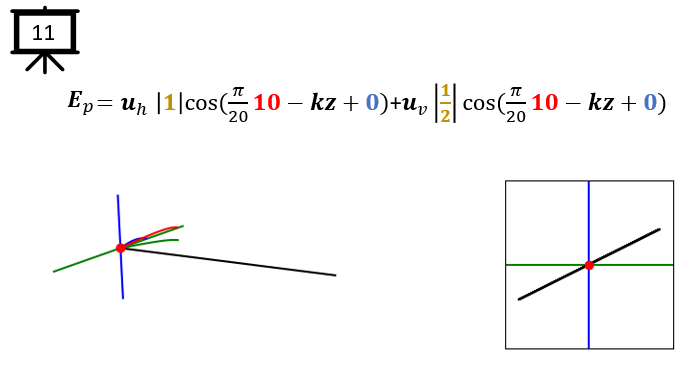
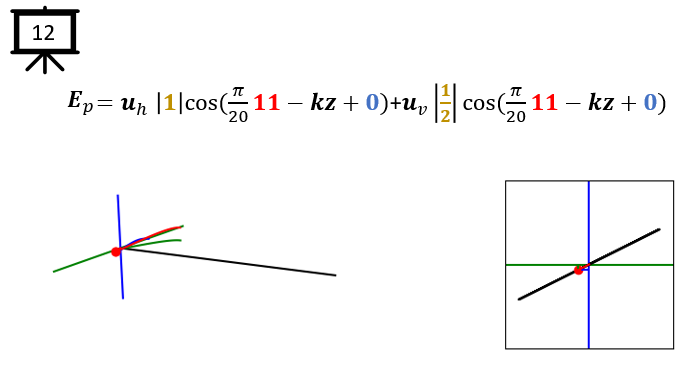
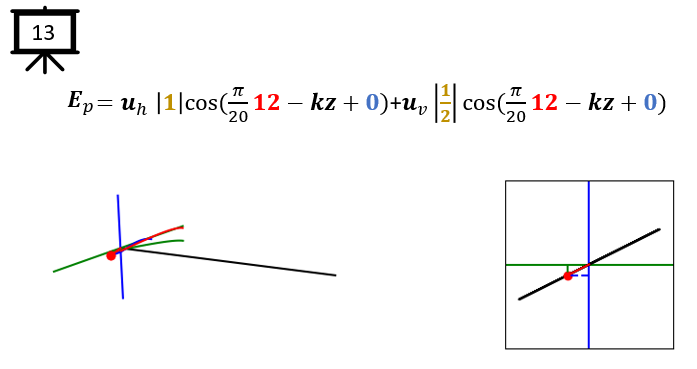
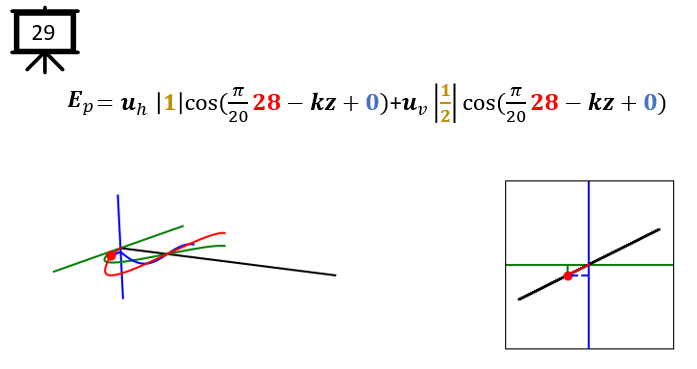
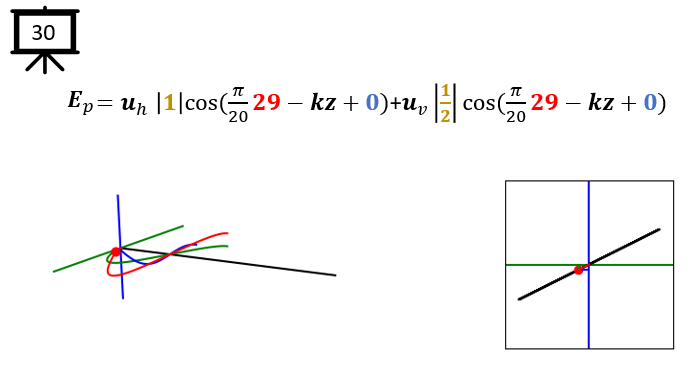
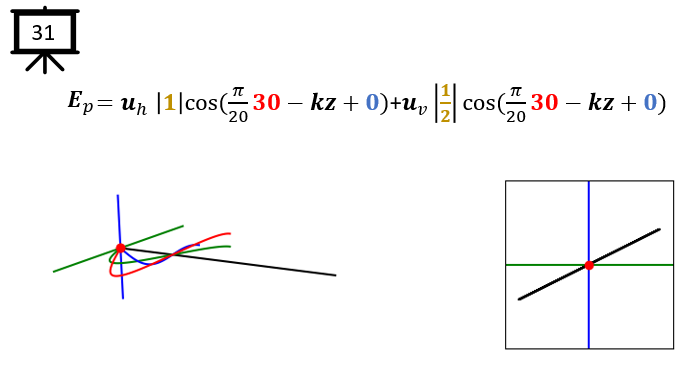
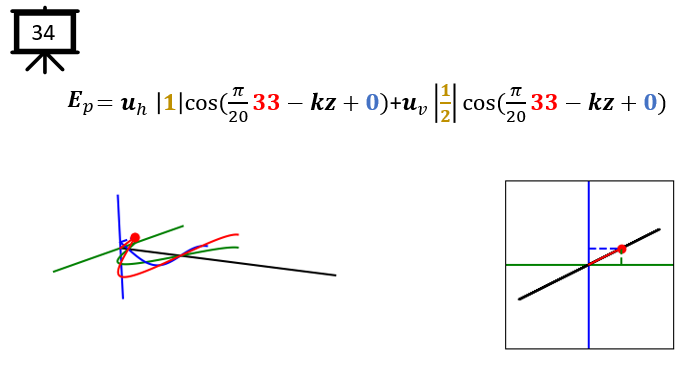
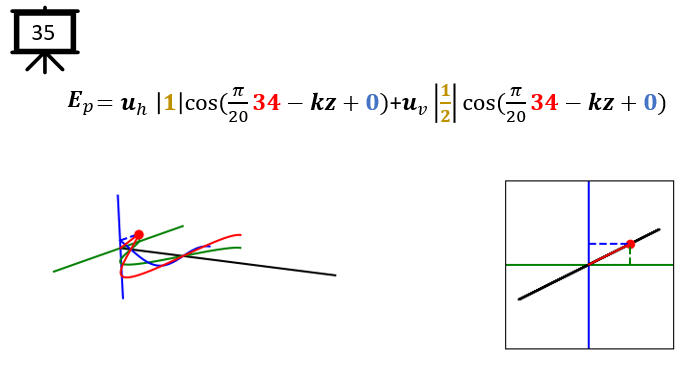
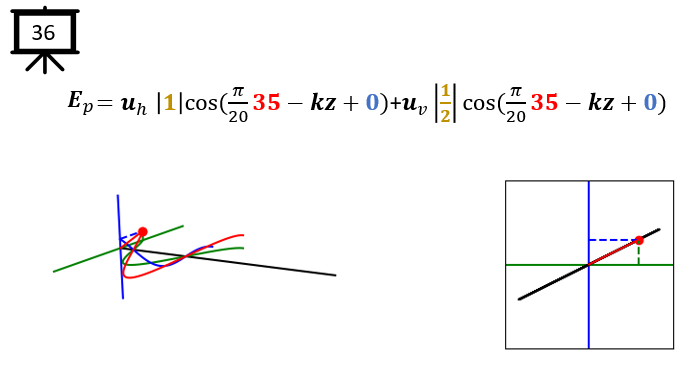
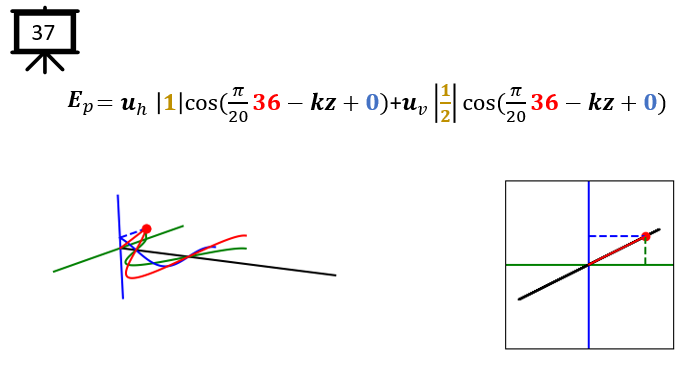
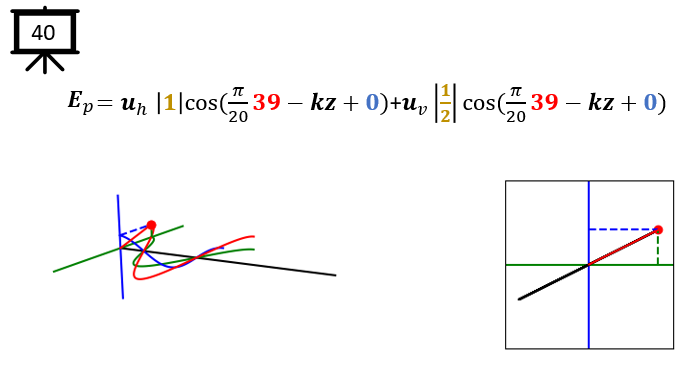
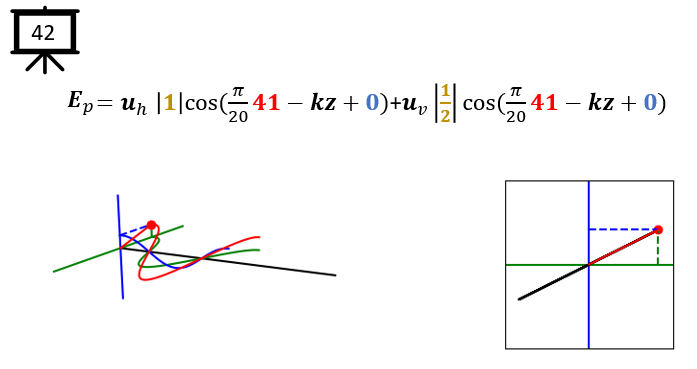
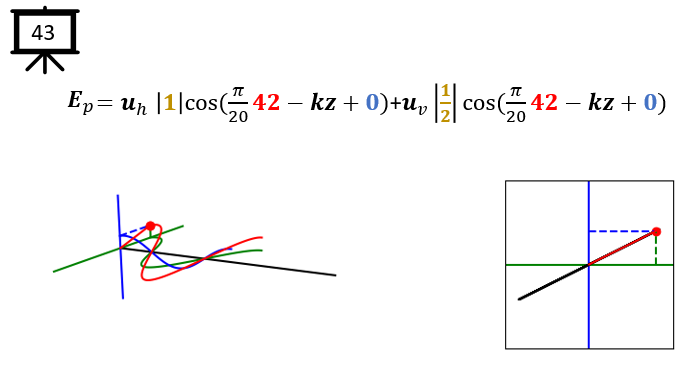
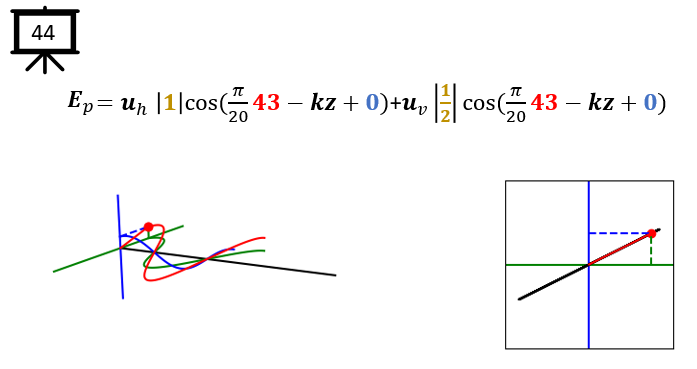
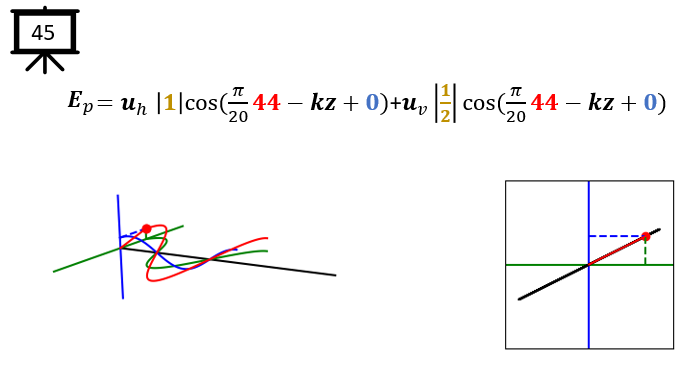
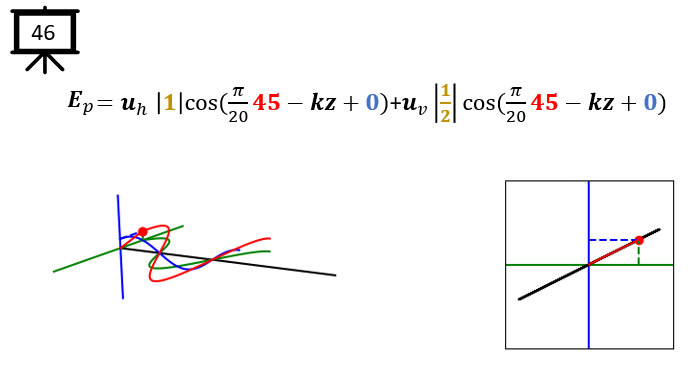
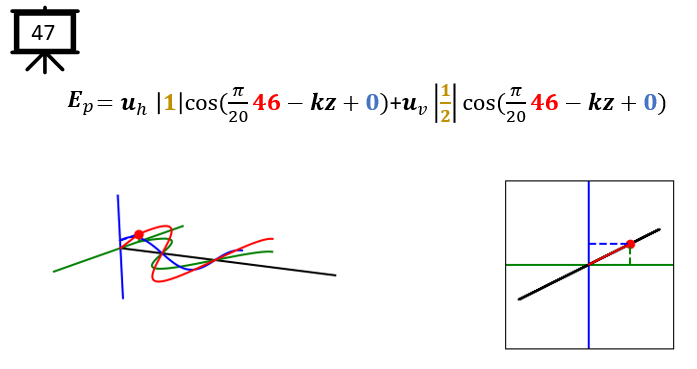
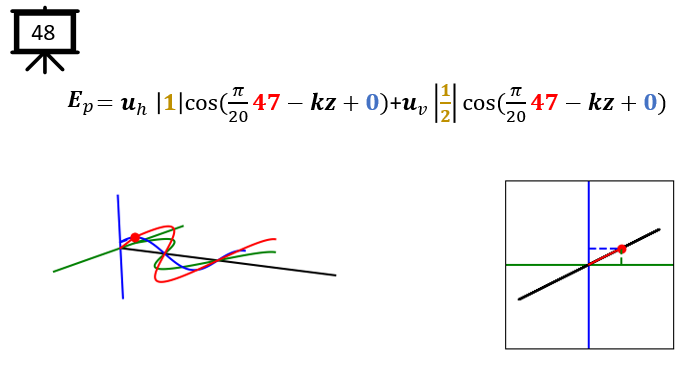
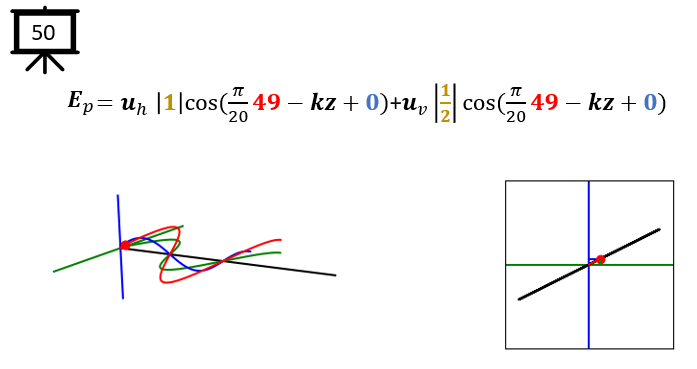
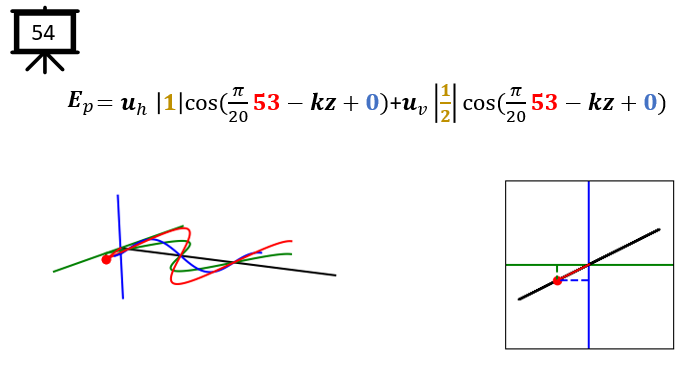
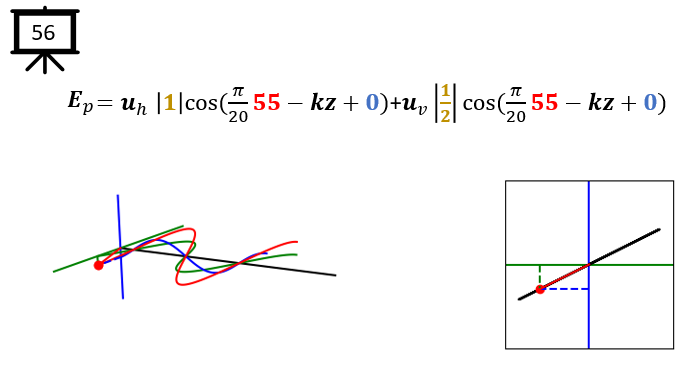
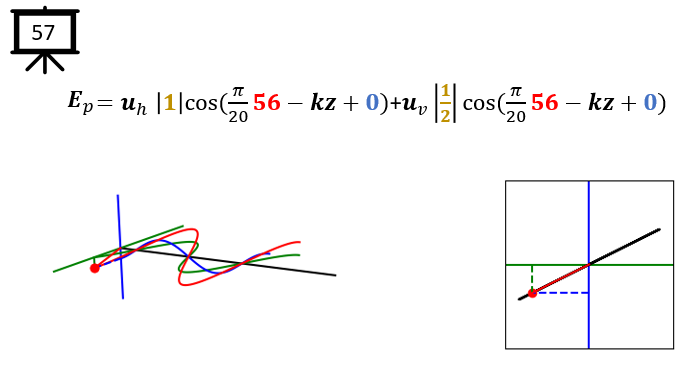
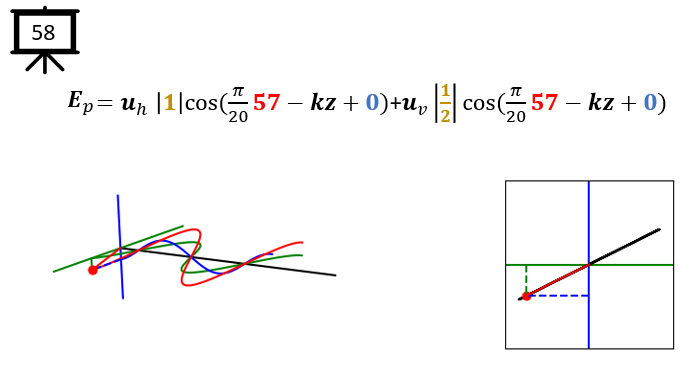
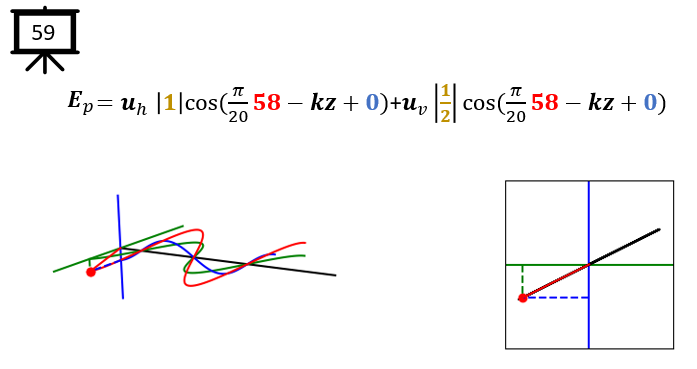
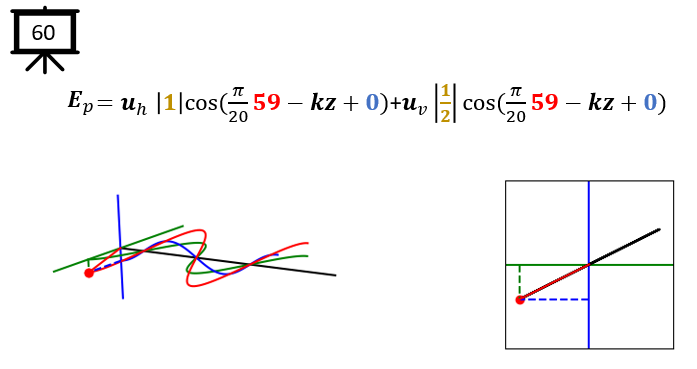
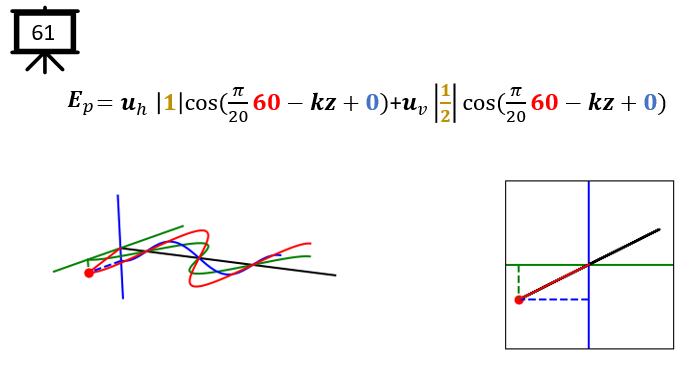
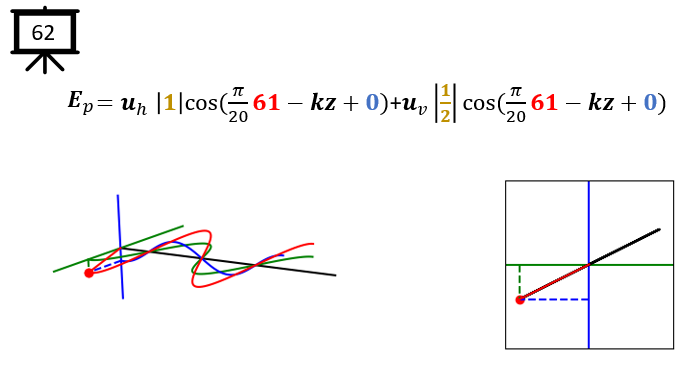
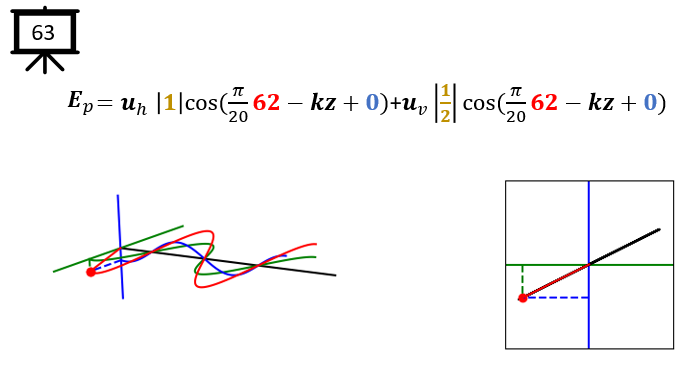
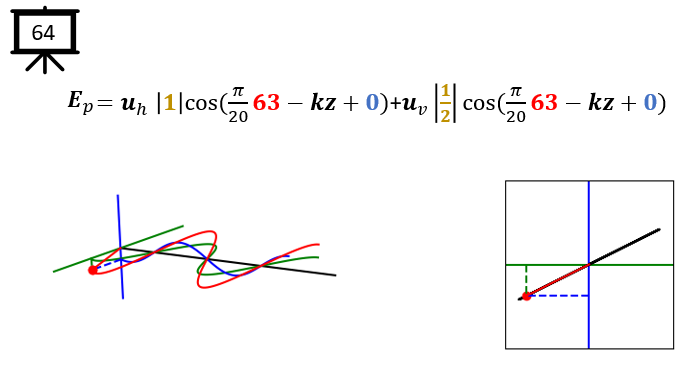
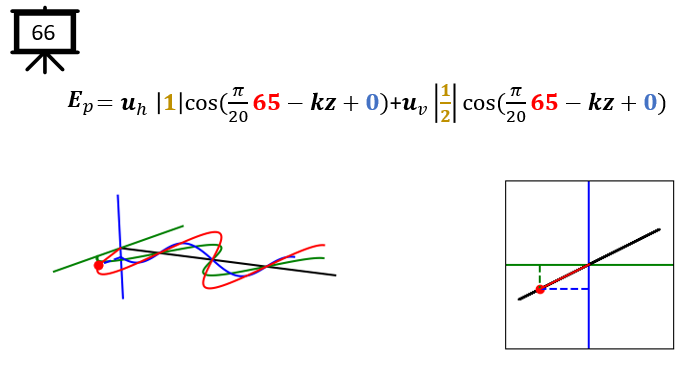
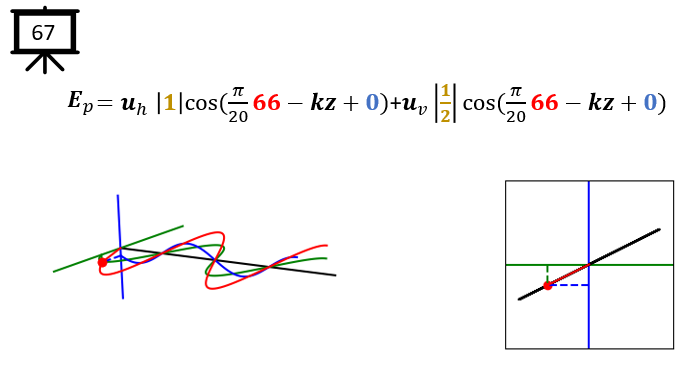
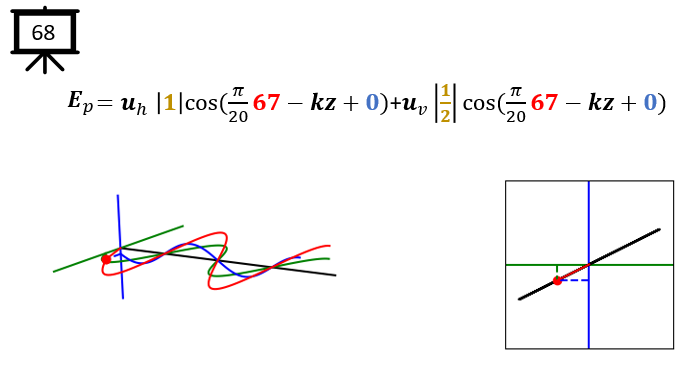
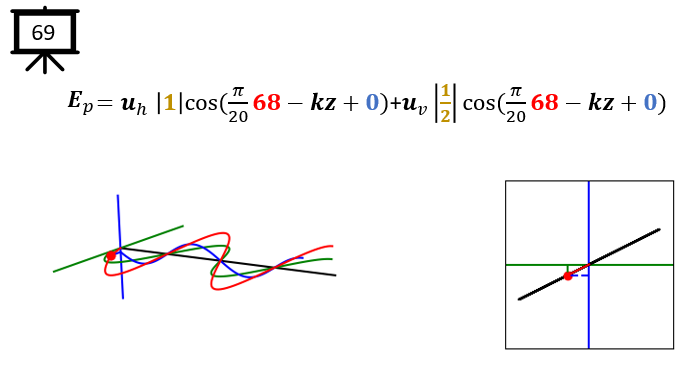
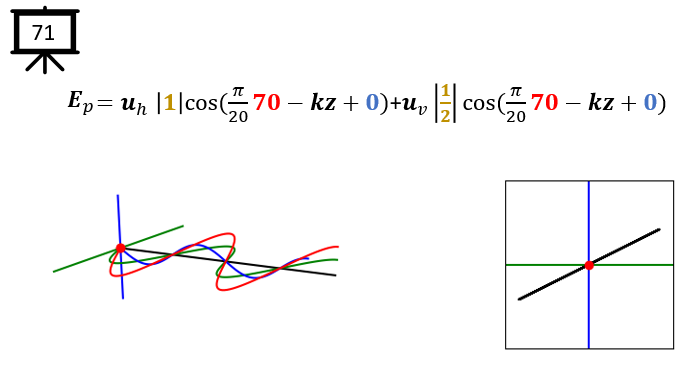
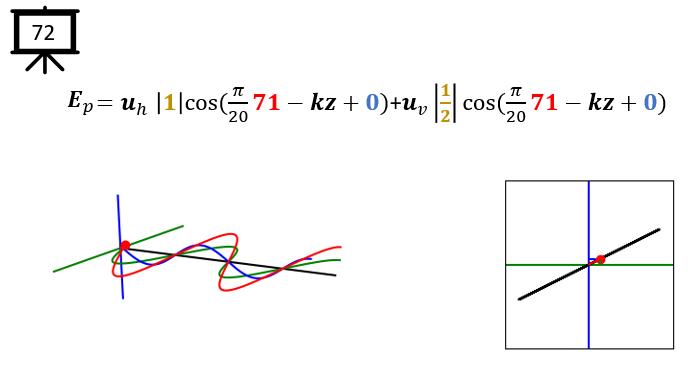
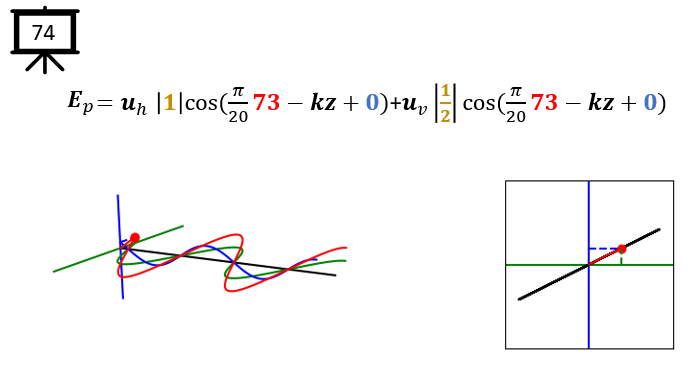
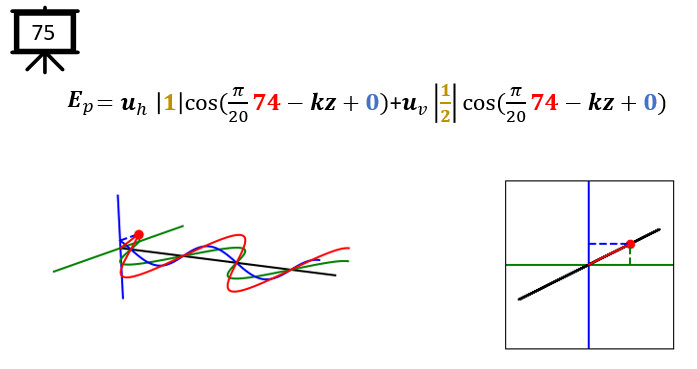
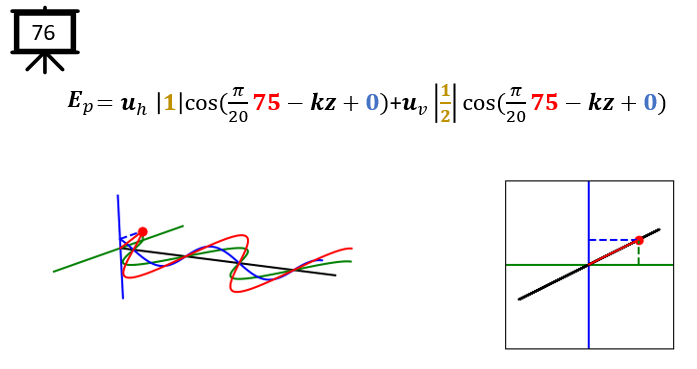
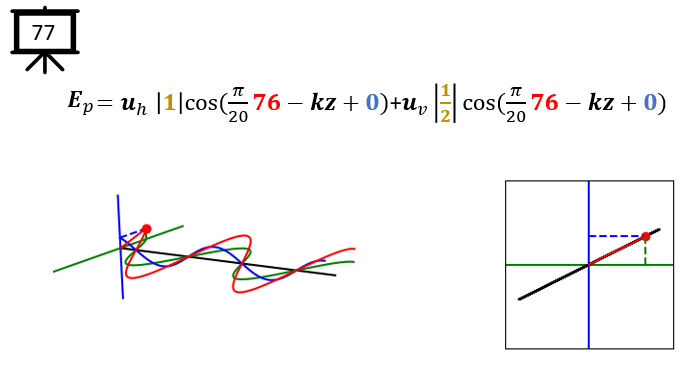
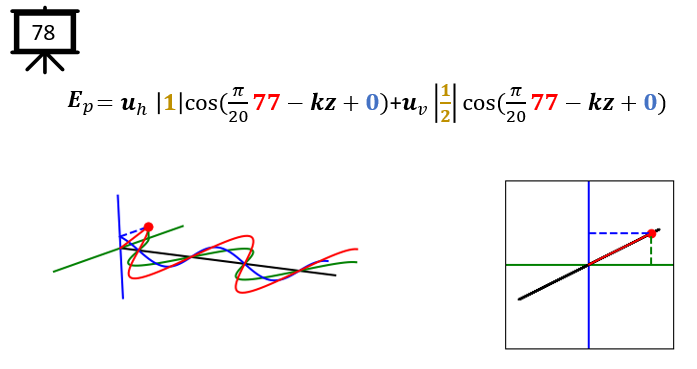
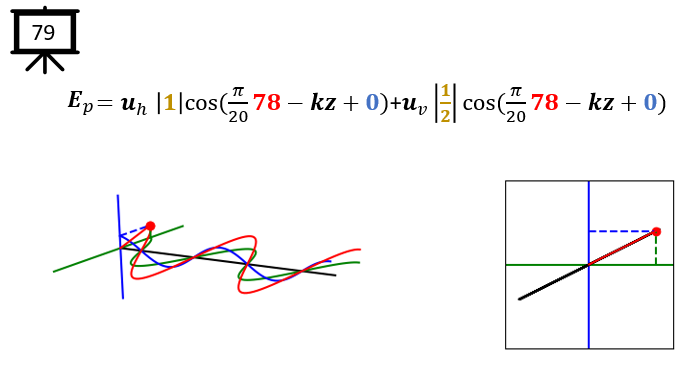
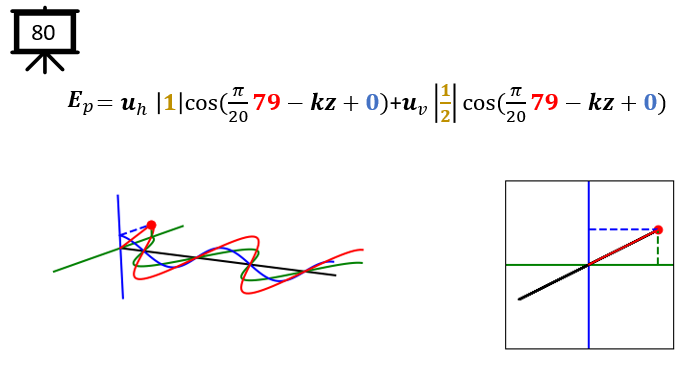
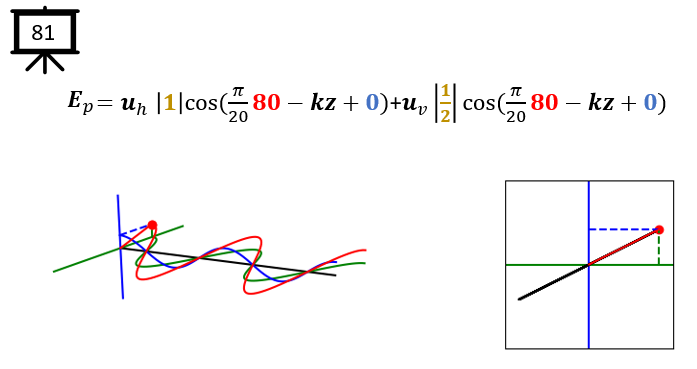
for i in range(81) :
startAngle = i*np.pi/20
hOff = 0*np.pi/20.0
Hamp = 0.5
Vamp = 1.0
pMax = 0*4*np.pi/40
if pMax > 40*np.pi/10:
pMax = startAngle - 40*np.pi/10
drawPropagatingWave(ax1,off = startAngle, Hoffset = hOff, Ha = Hamp, Va = Vamp, plotMax = pMax)
drawPhaseDiagram(ax2,max = 4*np.pi, offset = startAngle, Hoffset = hOff, Ha = Hamp, Va = Vamp)
fig.canvas.draw()
fname = 'RF_Propagration_H_1_0_V_1_0_Hamp_0_50'+'{:02d}'.format(i)+'.png'
#fname = 'RF_Propagration_H_1_0_V_1_0_hOff_'+'{:02d}'.format(i)+'.png'
plt.savefig(os.path.abspath(os.getcwd()) +'\\temp\\'+fname)
ax1.clear()
ax2.clear()
|