|
< Code 1 >
m = 1.0;
k = 0.75;
c = 0.3;
F0 = 0.5;
tmax = 100;
yinit = 0.0;
hFig = figure(1,'Position',[300 300 700 600]);
n = 17;
w = 0.05 * n;
wn = sqrt(k/m);
zeta = c/(2*sqrt(k*m));
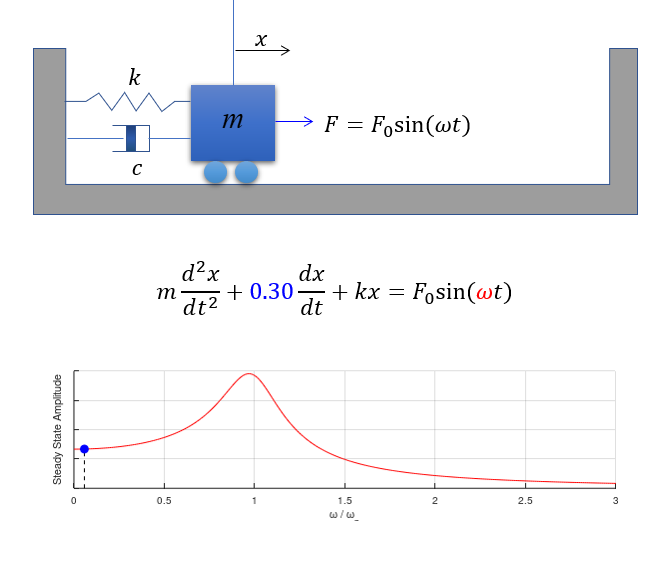
dy_dt = @(t,y) [y(2);...
-(c/m) * y(2) - (k/m) * y(1) + (F0/m) * sin(w*t)];
odeopt = odeset ('RelTol', 0.00001, 'AbsTol', 0.00001,'InitialStep',0.5,'MaxStep',0.5);
[t,y] = ode45(dy_dt,[0 tmax], [yinit 0.0],odeopt);
subplot(3,7,[1 7] );
tx = 0.2;
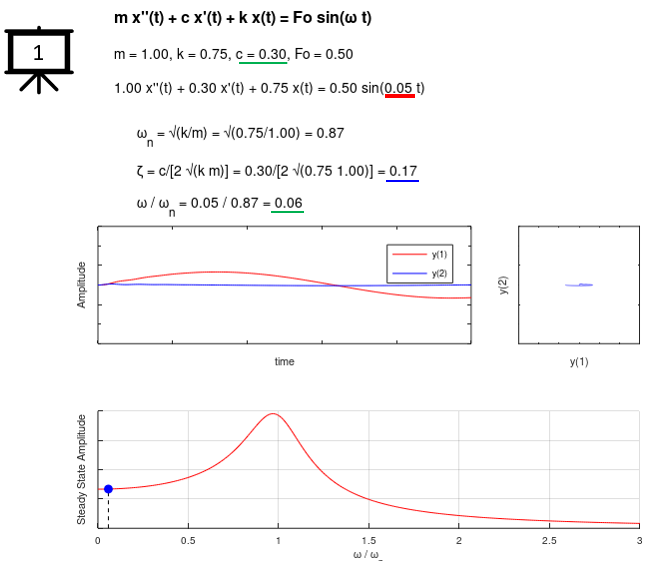
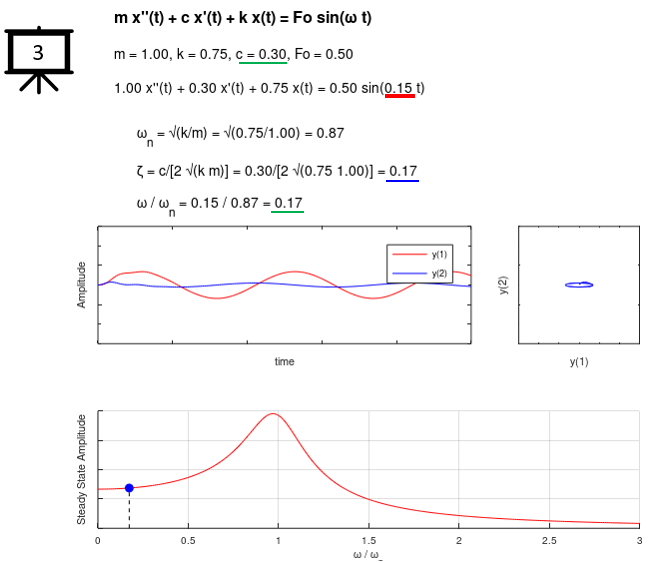
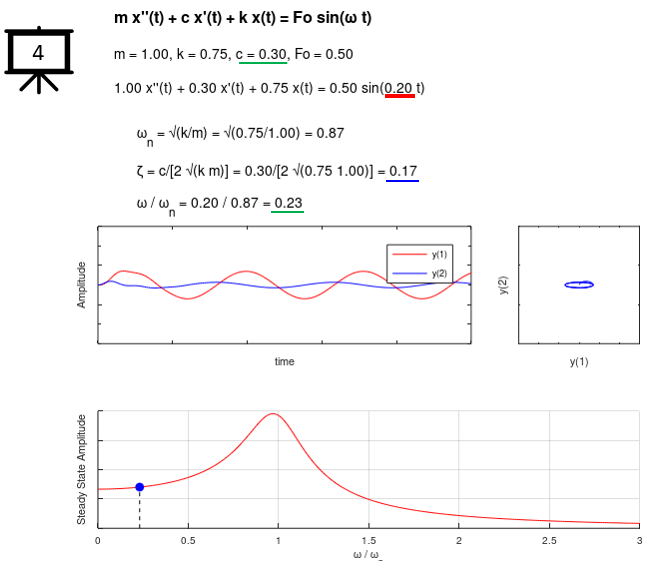
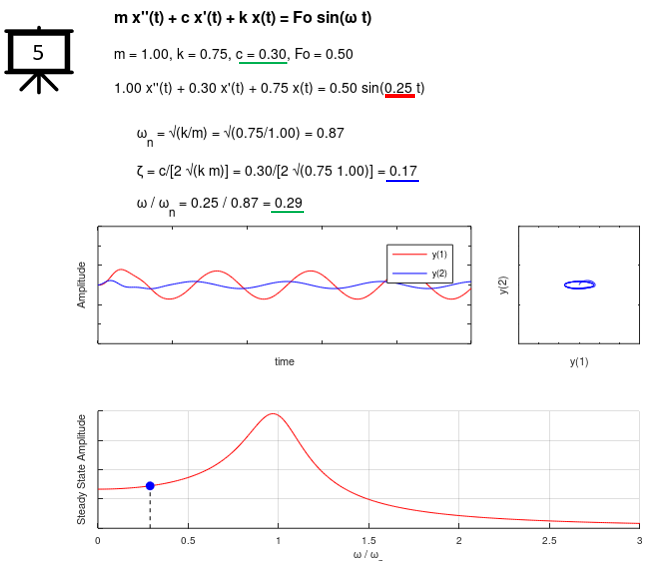
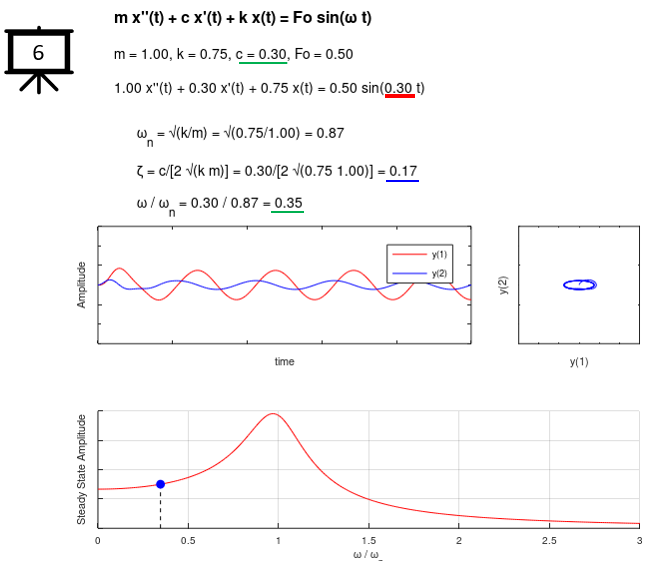
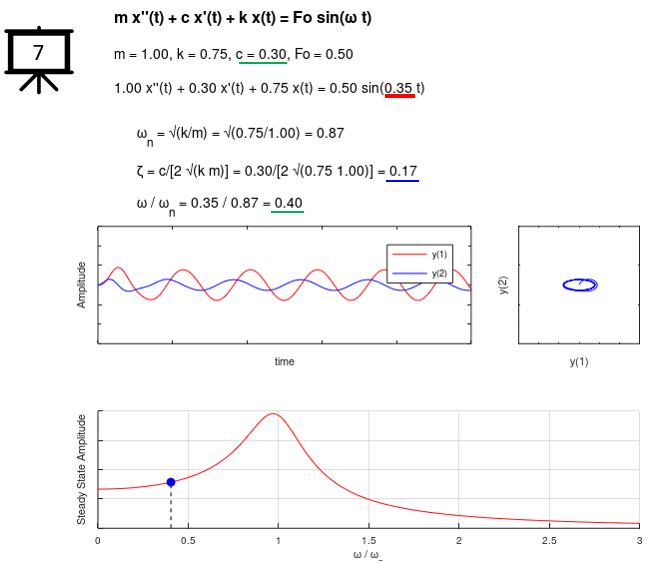
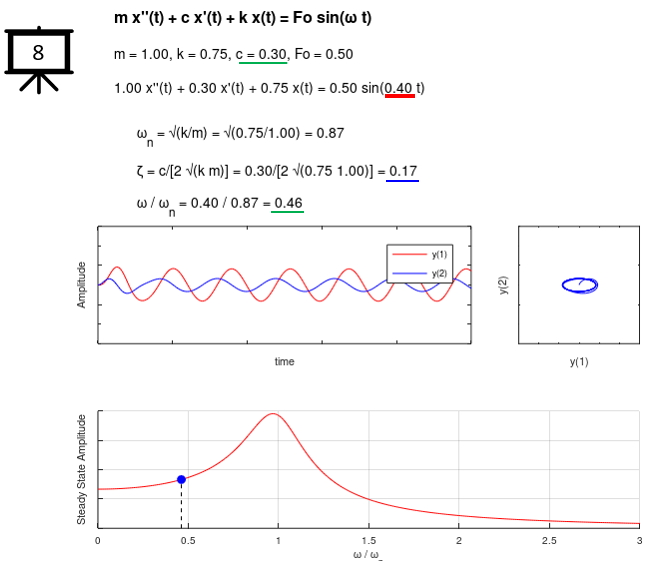
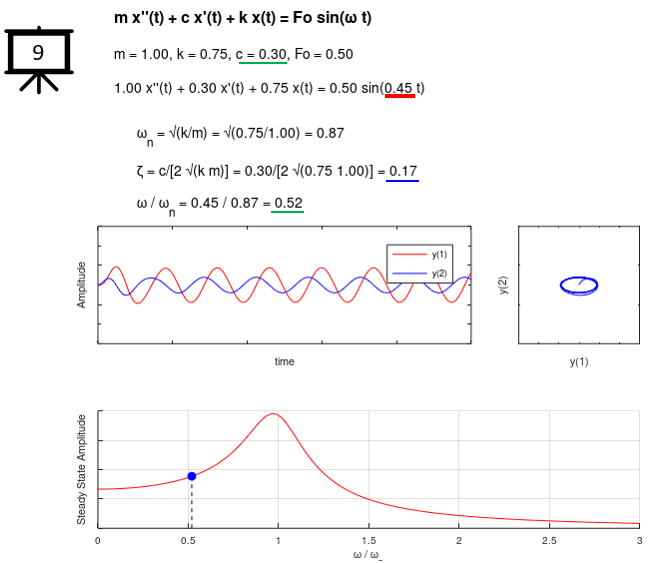
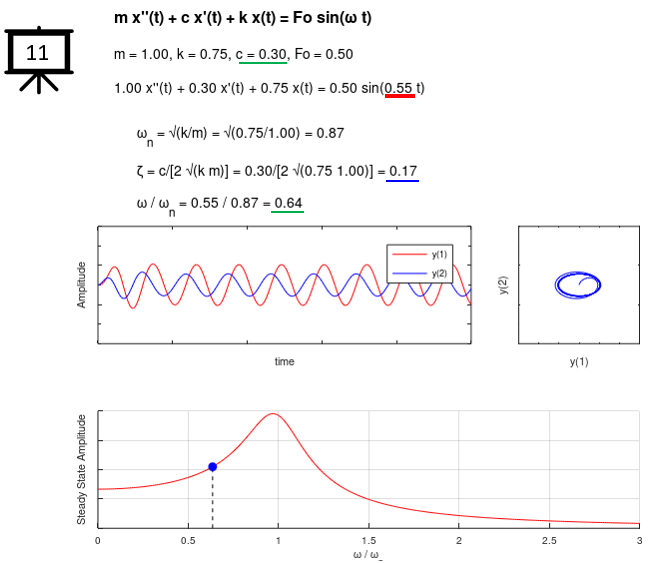
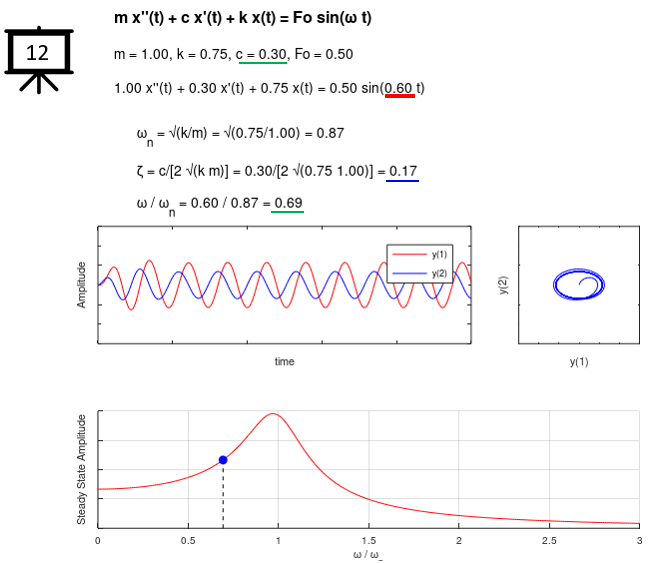
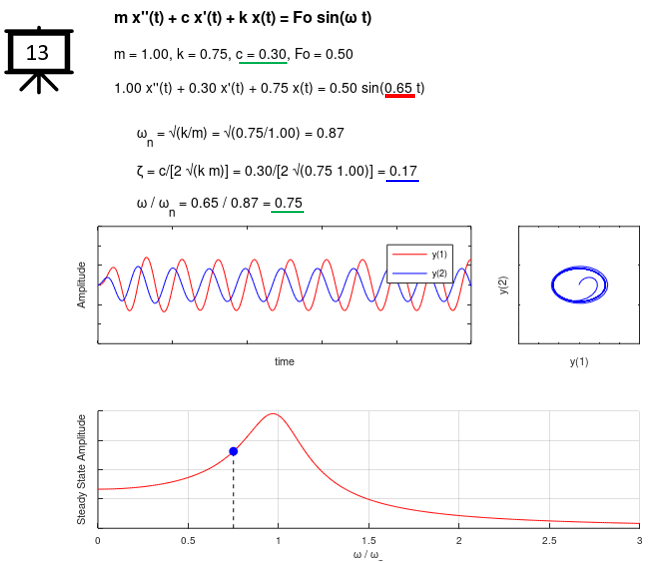
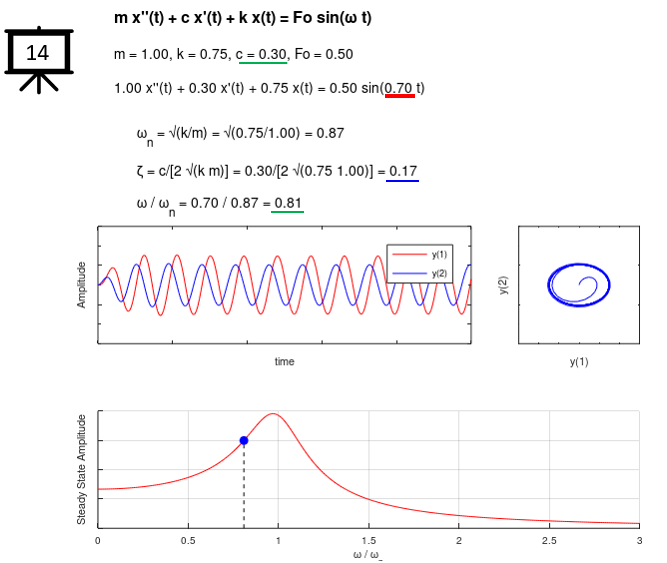
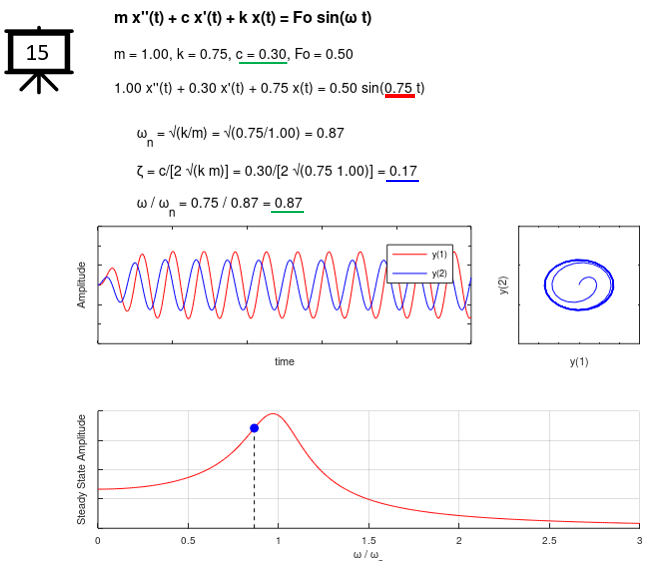
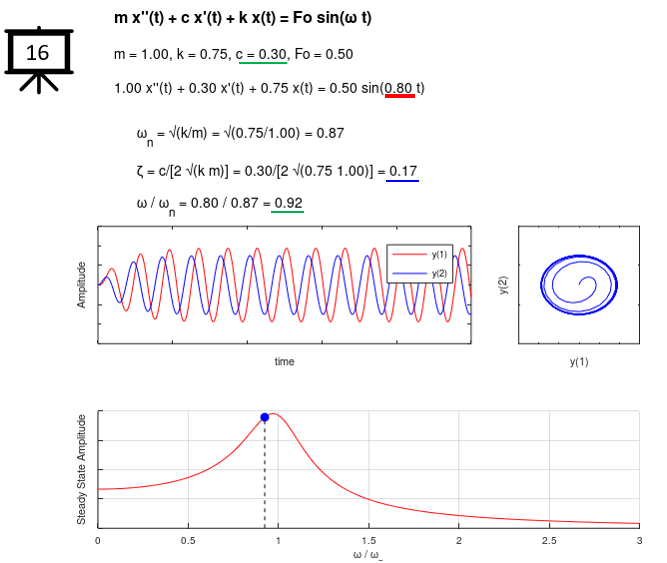
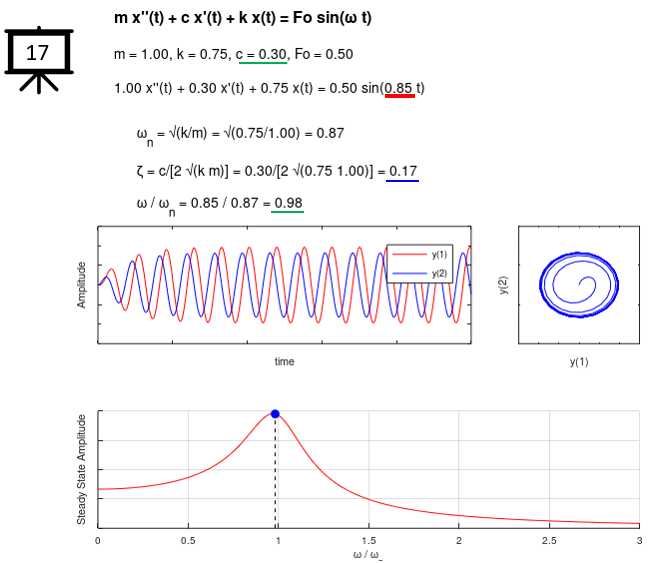
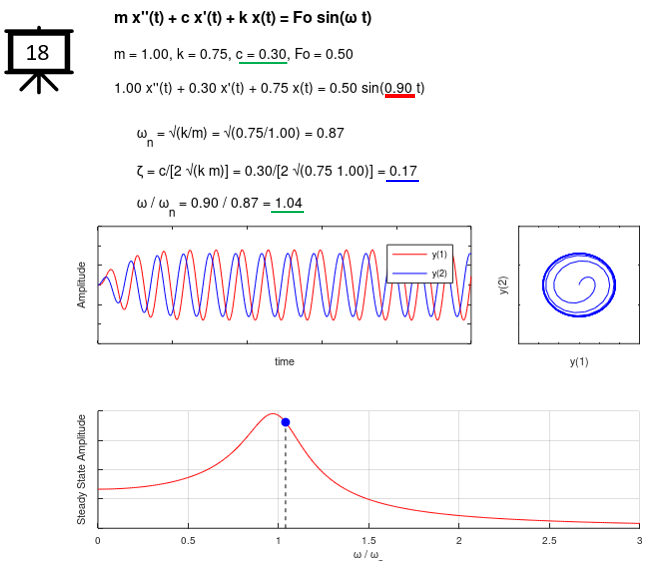
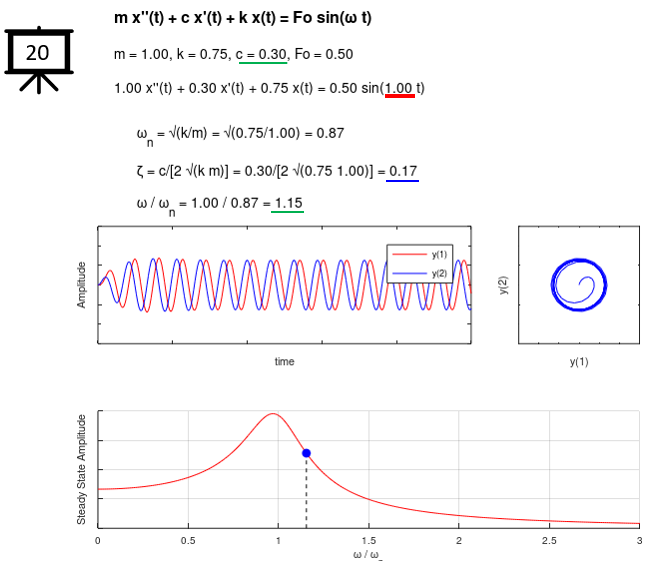
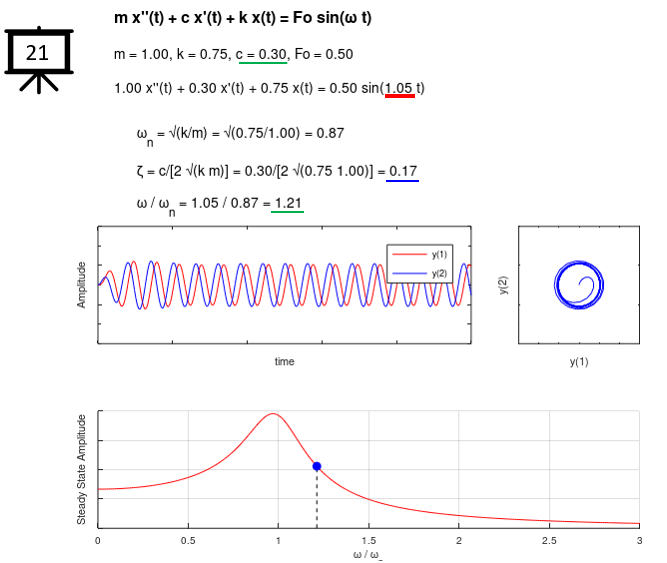
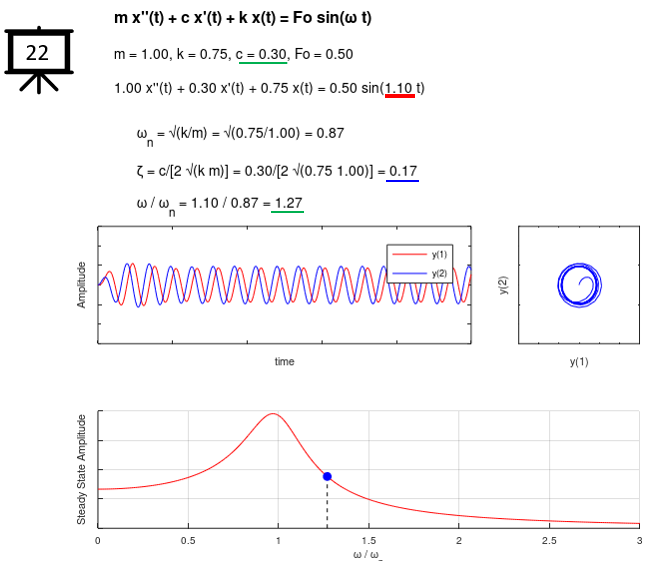
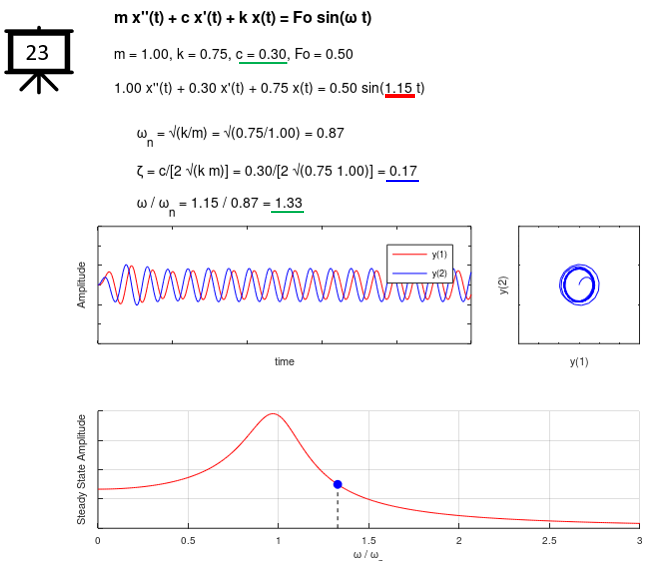
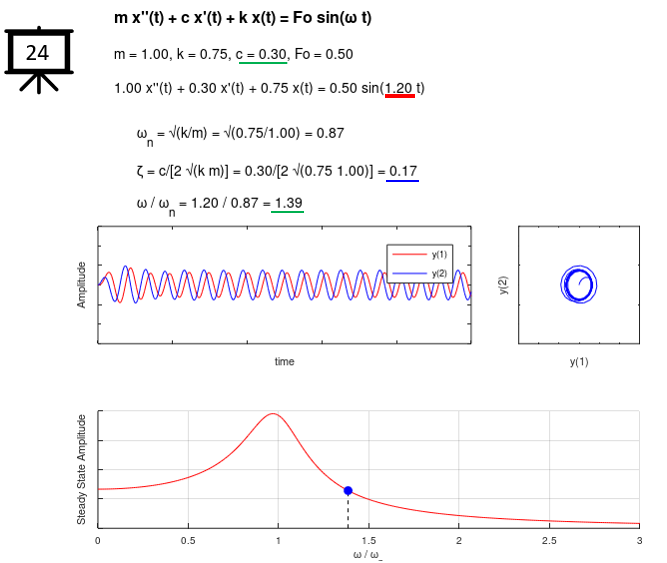
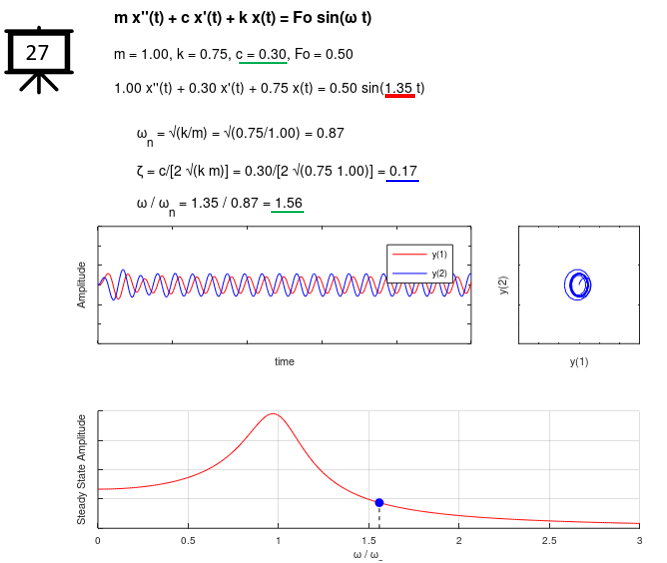
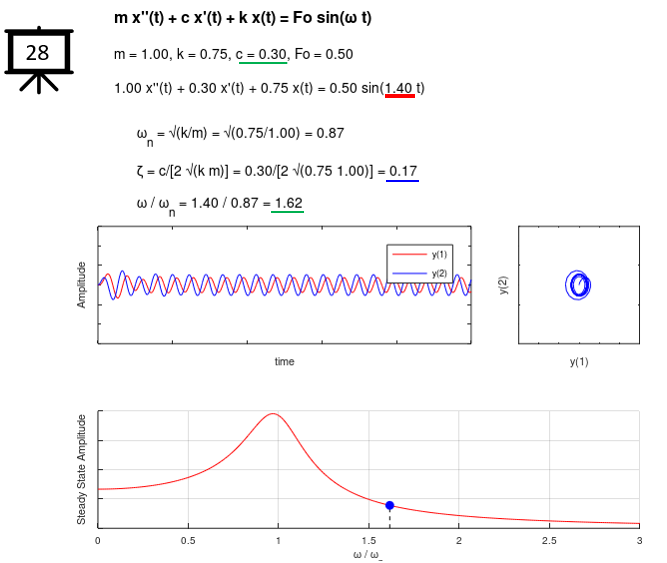
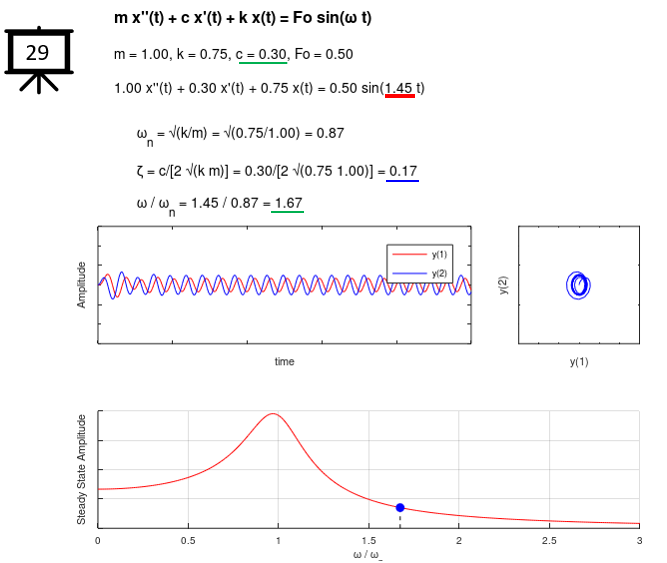
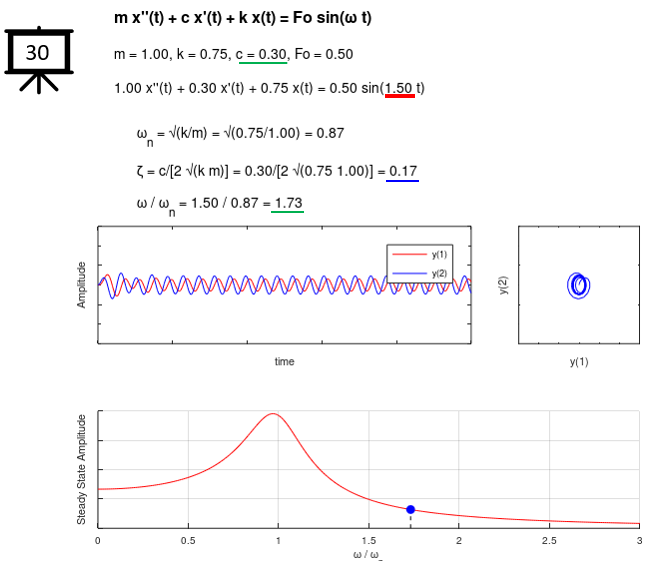
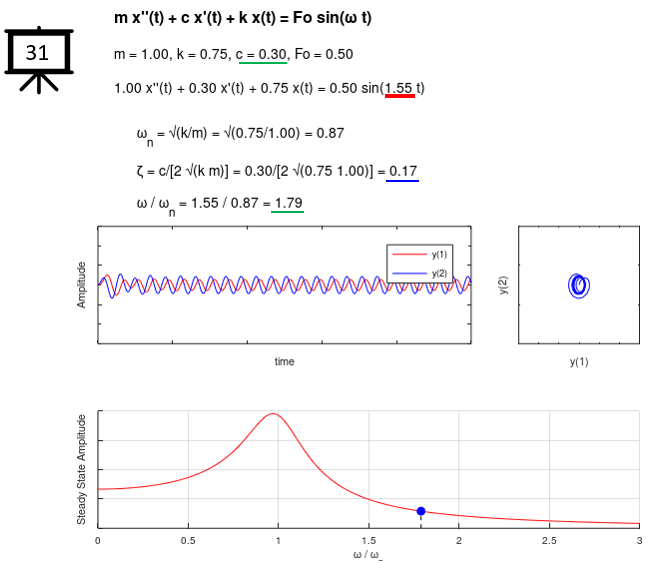
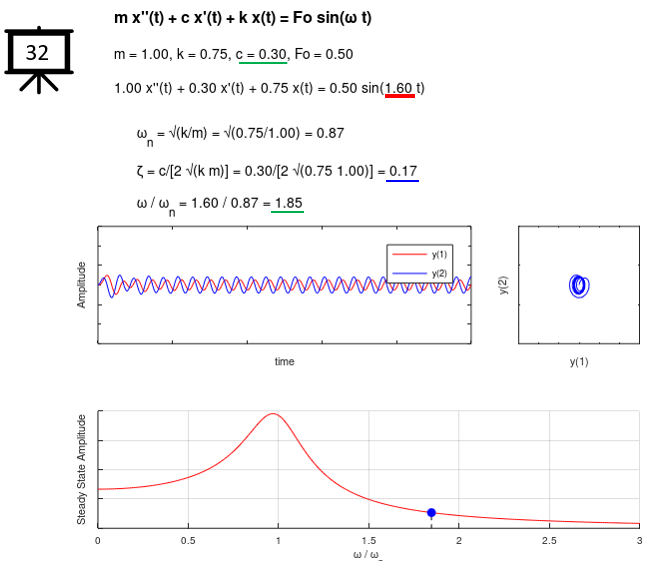
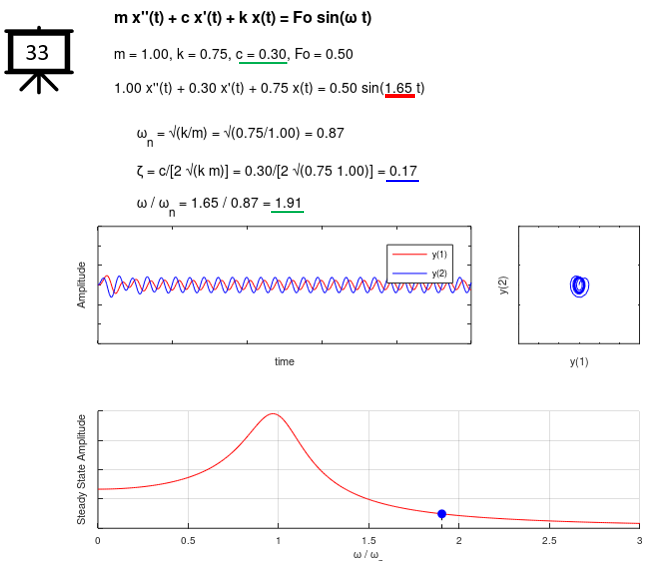
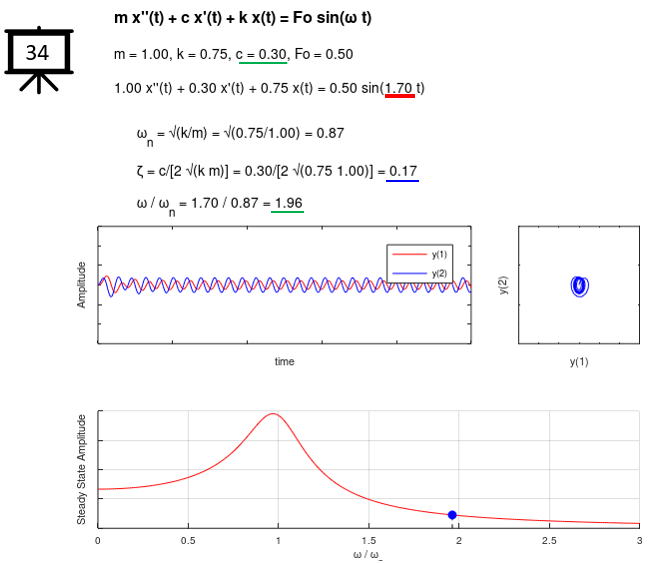
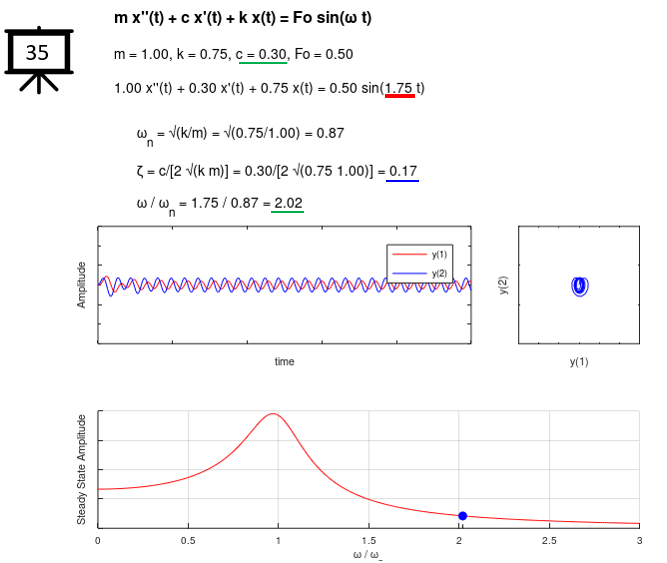
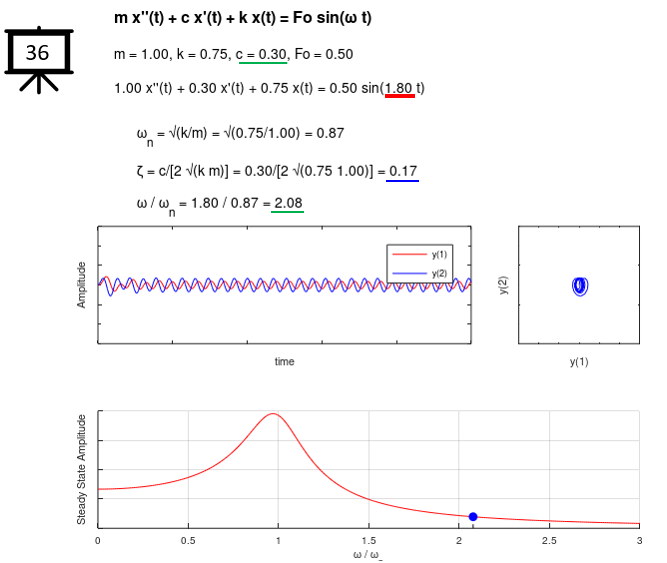
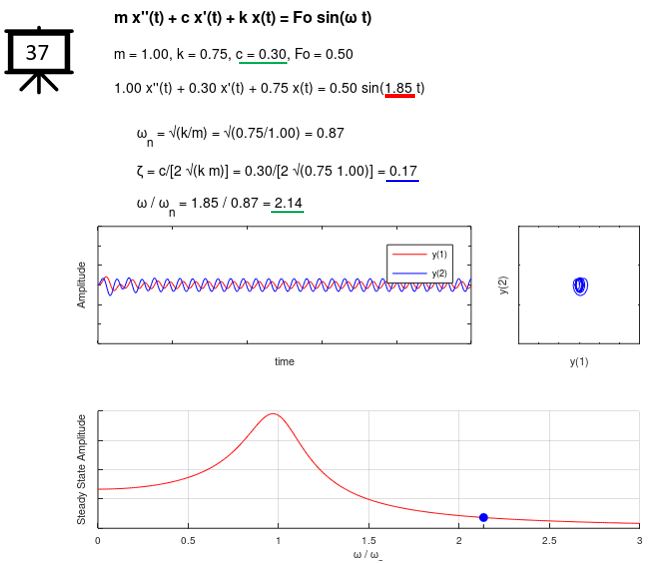
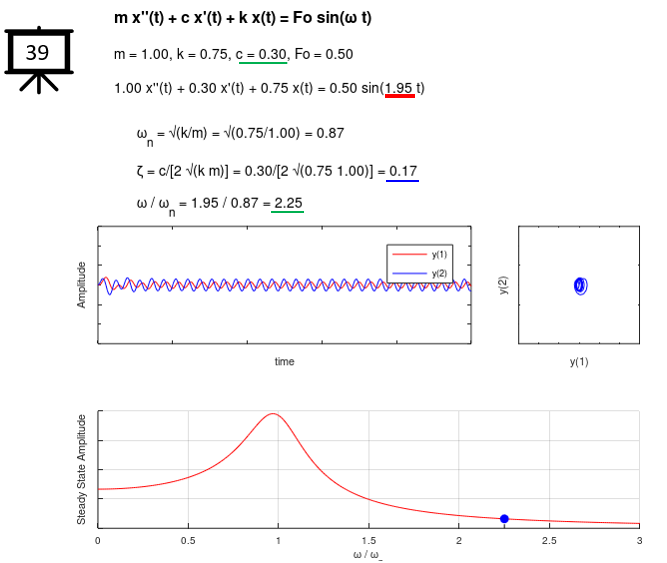
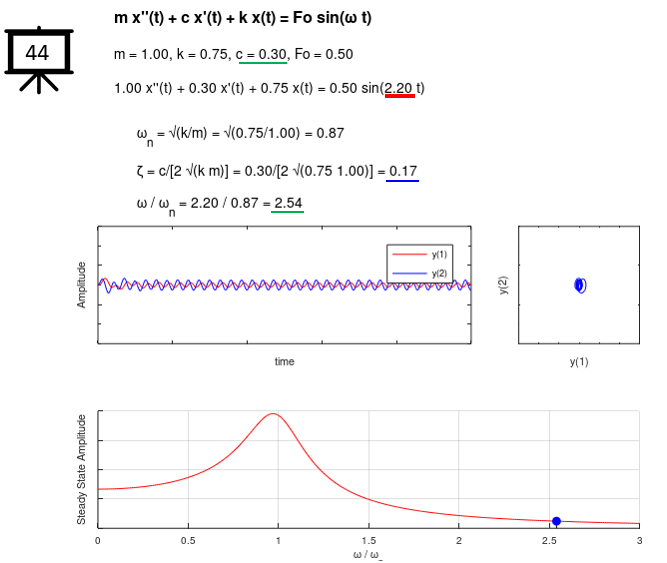
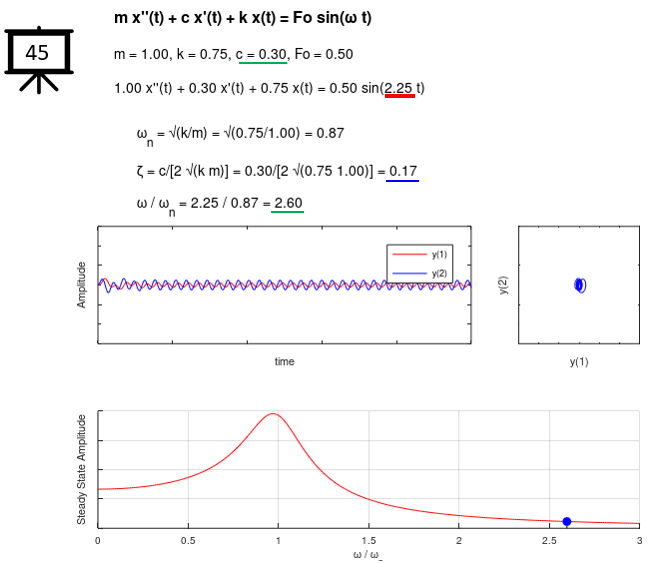
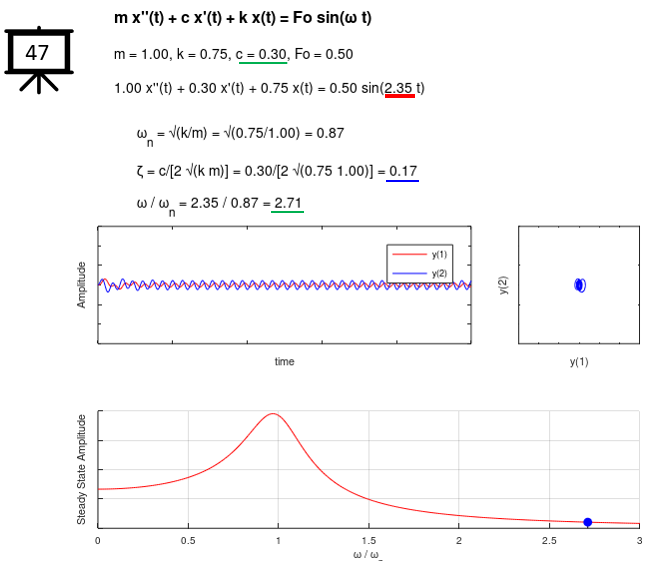
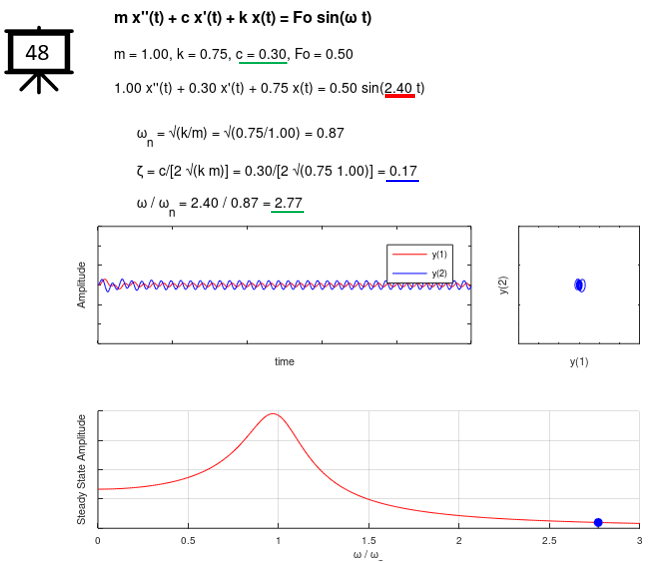
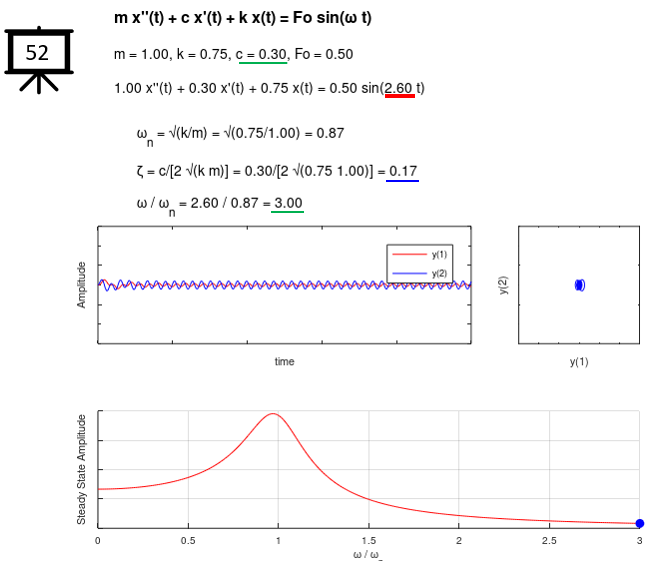
text(tx,1.2,"m x''(t) + c x'(t) + k x(t) = Fo sin(\\omega t)",'FontSize',16,'fontweight','bold');
tx = 0.2;
tStr = sprintf("m = %0.2f, k = %0.2f, c = %0.2f, Fo = %0.2f",m,k,c,F0);
text(tx,0.9,tStr,'FontSize',14);
tStr = sprintf("%0.2f x''(t) + %0.2f x'(t) + %0.2f x(t) = %0.2f sin(%0.2f t)", ...
m,c,k,F0,w);
text(tx,0.6,tStr,'FontSize',14);
tx = 0.5;
tStr = sprintf("\\omega_n = \\surd{(k/m)} = \\surd{(%0.2f/%0.2f)} = %0.2f",k,m,wn);
text(tx,0.2,tStr,'FontSize',14);
tStr = sprintf("\\zeta = c/[2 \\surd(k m)] = %0.2f/[2 \\surd(%0.2f %0.2f)] = %0.2f",c,k,m,zeta) ;
text(tx,-0.1,tStr,'FontSize',14);
wRatio = w/wn;
tStr = sprintf("\\omega / \\omega_n = %0.2f / %0.2f = %0.2f",w,wn,wRatio) ;
text(tx,-0.4,tStr,'FontSize',14);
axis([0 7 0 1]);
set(gca,'Visible','off')
subplot(3,7,[8 12] );
%plot(t,y(:,1),'r-',t,y(:,2),'b-',t,sin(w*t),'k--');
plot(t,y(:,1),'r-',t,y(:,2),'b-');
ylim([-3 3]);
legend('y(1)','y(2)');
xlabel('time');
ylabel('Amplitude');
set(gca,'xticklabel',[]);
set(gca,'yticklabel',[]);
subplot(3,7,[13 14]);
plot(y(:,1),y(:,2),'b-');
xlim([-3 3]); ylim([-3 3]);
xlabel('y(1)');
ylabel('y(2)');
set(gca,'xticklabel',[]);
set(gca,'yticklabel',[]);
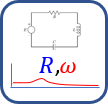
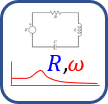
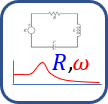
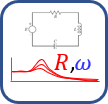
subplot(3,7,[15 21]);
w = 0:0.01:5;
nw = w ./ wn;
Amp = (F0/k) ./ sqrt((1 - (nw .^ 2)).^2 + (2 * zeta * nw).^2 );
Ap = (F0/k) ./ sqrt((1 - (wRatio .^ 2)).^2 + (2 * zeta * wRatio).^2 );
hold on;
plot(nw,Amp,'r-');
plot([wRatio wRatio],[0 Ap],'k--');
plot([wRatio],[Ap],'bo','MarkerFaceColor',[0 0 1],'MarkerSize',8);
xlabel('\omega / \omega_n');
ylabel('Steady State Amplitude');
axis([0 3 0 2]);
set(gca,'yticklabel',[]);
grid on;
hold off;
|