|
The code simulates antenna steering by coherently combining element patterns with a progressive phase shift between elements. The beam direction is controlled by the starting phase and inter-element phase shift.
-
Key steps:
-
Create meshgrid for radiation pattern plot
-
Set number of elements n and spacing k
-
Define initial phase p and phase shift amount s
-
Loop through elements, incrementing phase each time
-
Add up radiation pattern from each element
-
Plot 3D pattern surface from two views
-
Key parameters:
-
n - number of antenna elements
-
k - spacing between elements
-
p - starting phase at first element
-
s - phase shift amount between elements
-
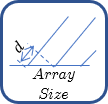
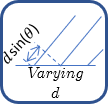
Varying n and k changes number of lobes
-
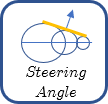
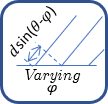
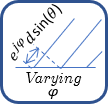
Varying p steers the initial beam direction
-
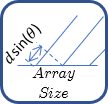
Varying s changes the scan angle
< Code 1 >
function main
xstep = -10*pi:pi/10:10*pi;
ystep = -10*pi:pi/10:10*pi;;
[X,Y] = meshgrid(xstep,ystep);
n=8; % should be even integer
k=2;
p = 36*pi/4;
s = (2*pi/10);
m = 0;
Z = zeros(length(xstep));
for i = ((0:(n-1))-((n-1)/2))
[X1,Y1] = meshgrid(xstep+(i*pi/k),ystep);
Z = Z+(waveCosPh(X1,Y1,p+m*s,p));
m = m+1;
end;
hFig = figure(1,'Position',[300 300 700 280]);
subplot(1,2,1);
surface(X,Y,Z,'edgecolor','none');
xlim([-10*pi 10*pi]);ylim([-10*pi 10*pi]);zlim([-10,10]);
view([-40 70]);
set(gca,'xticklabel',[]);
set(gca,'yticklabel',[]);
set(gca,'zticklabel',[]);
set(gca,'xtick',[]);
set(gca,'ytick',[]);
set(gca,'ztick',[]);
subplot(1,2,2);
surface(X,Y,Z,'edgecolor','none');
xlim([-10*pi 10*pi]);ylim([-10*pi 10*pi]);zlim([-10,10]);
view([0 90]);
set(gca,'xticklabel',[]);
set(gca,'yticklabel',[]);
set(gca,'zticklabel',[]);
set(gca,'xtick',[]);
set(gca,'ytick',[]);
set(gca,'ztick',[]);
end
function z = waveCosPh(x,y,Ph,r)
d = sqrt(x.^2 + y.^2)-Ph;
dim = size(d);
dr = dim(1);
dc = dim(2);
for i = 1 : dr
for j = 1 : dc
if d(i,j) > r
d(i,j) = pi/2;
end;
end;
end;
%z = cos(d-Ph);
z = cos(d);
end
|