|
System Simulation - SSB Detection
This note is an interactive GUI application for detecting and analyzing 5G NR SSB (Synchronization Signal Block) from binary IQ files. The tool performs blind detection of PSS/SSS sequences, extracts the resource grid, and provides comprehensive visualization of the detected signals. It supports radio channel simulation (AWGN, TDL, CDL) and offers multiple analysis views including spectrum analysis, resource grid visualization, and constellation plots.
This program provides an interactive graphical tool for examining the receiver-side processing of 5G NR signals using real captured IQ data, rather than simulated waveforms. Its main purpose is to make the internal RX processing steps of NR visible and understandable, starting from raw time-domain IQ samples and progressing through synchronization, SSB detection, OFDM demodulation, and resource grid reconstruction. By visualizing each intermediate result, the tool allows users to observe how
practical impairments such as timing offset, frequency offset, noise, and channel effects influence the received signal. This makes it especially useful for learning, debugging, and validating NR receiver algorithms with real-world measurements.
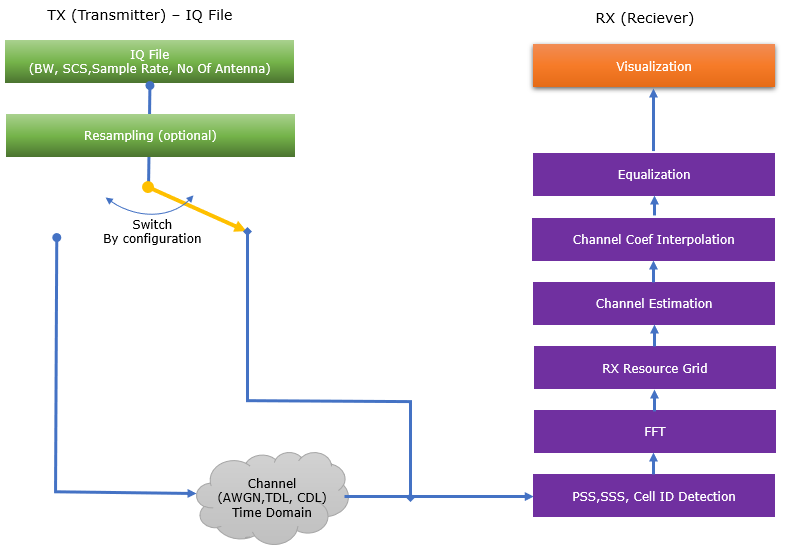
Followings are brief descriptions on each procedure with the focus on sionna api
- Input: Binary IQ file format (repetition of 4-byte float I and 4-byte float Q)
- Reads complex IQ samples as pairs of 4-byte floats
- Supports variable file sizes and durations
- Resampling: Optional resampling to target sample rate (default: 23.04 MS/s)
- Uses scipy.signal.resample for sample rate conversion
- Configurable target sample rate via GUI
- Preserves signal characteristics during resampling
- Channel Simulation: Optional radio channel application (NONE, AWGN, TDL, CDL) with configurable profiles and SNR
- NONE: No channel applied (pass-through)
- AWGN: Additive White Gaussian Noise (always applied when channel is enabled)
- Implemented using NumPy (not Sionna API)
- Adds Gaussian noise with configurable SNR
- TDL: Tapped Delay Line channel with 3GPP profiles (A/B/C/D/E)
- Sionna API (if available): Uses sionna.phy.channel.tr38901.TDL with PanelArray for antenna configuration
- Applied in frequency domain (after FFT conversion)
- Uses TensorFlow/Keras layer interface
- Requires PanelArray from Sionna for antenna array setup
- Custom Fallback (if Sionna unavailable): Custom frequency-selective channel implementation
- Applied in time domain to raw IQ data
- Generates multipath taps with profile-specific delay spreads
- Falls back to custom implementation if Sionna API fails or is unavailable
- CDL: Clustered Delay Line channel with 3GPP profiles (A/B/C/D/E)
- Sionna API (if available): Uses sionna.phy.channel.tr38901.CDL with PanelArray for antenna configuration
- Applied in frequency domain (after FFT conversion)
- Uses TensorFlow/Keras layer interface
- Requires PanelArray from Sionna for antenna array setup
- Custom Fallback (if Sionna unavailable): Custom frequency-selective channel implementation
- Applied in time domain to raw IQ data
- Generates clustered multipath with profile-specific characteristics
- Falls back to custom implementation if Sionna API fails or is unavailable
- Seed Mode: Fixed (reproducible) or Random (varying) seed for channel generation
- Channel is applied before any detection or processing steps
- Sionna API Components Used:
- sionna.phy.channel.tr38901.TDL / sionna.channel.tr38901.TDL - TDL channel model
- sionna.phy.channel.tr38901.CDL / sionna.channel.tr38901.CDL - CDL channel model
- sionna.phy.channel.PanelArray / sionna.channel.PanelArray / sionna.antenna.PanelArray - Antenna array configuration
- PSS/SSS Detection: Blind correlation-based detection of Primary/Secondary Synchronization Signals
- PSS Detection: Time-domain correlation search across frequency offsets
- Brute-force scan across bandwidth in steps of SCS
- Detects n_id_2 (0, 1, or 2) from PSS sequence
- SSS Detection: Matrix search after PSS detection
- Detects n_id_1 (0-335) from SSS sequence
- Calculates full Cell ID (PCI = 3 × n_id_1 + n_id_2)
- Timing Offset: Detects symbol timing from correlation peak
- Frequency Offset: Estimates frequency offset from PSS correlation
- All detection performed in time domain before FFT
- FFT (Time to Frequency Domain): OFDM symbol extraction and conversion
- Removes Cyclic Prefix (CP) and applies FFT per symbol
- Optional Hanning window for spectral leakage reduction
- Timing offset adjustment with configurable safety margin
- Output: Frequency-domain OFDM symbols
- Frequency Offset Correction: Integer bin shifting for frequency offset compensation
- Uses integer bin offset calculated from detected frequency offset
- Applied during resource grid extraction (not time-domain frequency shift)
- Preserves signal quality by avoiding interpolation artifacts
- Resource Grid Extraction: OFDM symbol extraction and resource grid reconstruction
- Maps frequency-domain symbols to resource grid structure
- Applies integer bin shifting for frequency alignment
- Extracts subcarriers based on bandwidth and SCS
- Output: Full resource grid (symbols × subcarriers)
- SSB Extraction: SSB-specific resource grid extraction (4 symbols, 240 subcarriers)
- Extracts PSS, SSS, PBCH, and PBCH DMRS components
- Maps to SSB structure per 3GPP TS 38.211 Section 7.4.3
- Separates components for individual analysis
- Channel Estimation & SSB ID Detection: Parametric channel estimation with blind SSB index detection
- SSB ID Detection: Blind search for i_ssb (0-7) using differential correlation
- Generates reference PBCH DMRS sequences for all 8 possible SSB indices
- Uses differential correlation metric robust to timing offset/phase wraps
- Selects SSB index with highest correlation metric
- Channel Estimation: Parametric estimation using detected PBCH DMRS
- Estimates average channel magnitude (h_avg)
- Estimates time slope (alpha) for CFO estimation
- Estimates frequency slope (beta) for timing offset estimation
- Uses detected SSB index to generate correct reference sequence
- Channel Coefficient Interpolation: Interpolates channel estimates across resource grid
- Interpolates from DMRS pilot positions to all resource elements
- Supports time and frequency interpolation
- Generates per-RE channel estimates for equalization
- Equalization: Channel compensation using estimated channel coefficients
- ZF (Zero Forcing): Direct inversion of channel estimate
- MMSE (Minimum Mean Square Error): Noise-aware equalization
- Applied to PSS/SSS (optional, configurable) and PBCH data
- CFO correction (optional, configurable) before equalization
- Visualization: Multiple GUI tabs for comprehensive analysis
- Analysis Tab: Text-based detection results and statistics
- Power vs Time: Time-domain power analysis with SSB markers
- Frequency Spectrum & Spectrogram: Welch PSD and time-frequency spectrogram
- NR Resource Grid: Full resource grid heatmap visualization
- SSB Resource Grid: SSB-specific grid with component annotations
- Channel Coefficient: Channel magnitude and phase (constellation format)
- Constellation: Scatter plots for PSS/SSS/PBCH/DMRS (before/after equalization)
Why Not Much of Sionna in this note ?
You may notice not much of Sionna API is used in this note considering the complexity of the script. The main reason is that Sionna provides building blocks for system simulation, not high-level SSB detection/analysis functions.
This tool implements the SSB detection and analysis pipeline from scratch because Sionna doesn't offer these high-level functions. It uses Sionna only for what it provides well (complex channel models like TDL/CDL), and implements the rest with custom code.
This is similar to using a library for validated components (channels) while building the application-specific logic (SSB detection) yourself. Followings are short descriptions on what are and what are not supported by Sionna in terms of this note.
- Sionna provides:
- Low-level components: Channel models (AWGN, TDL, CDL), mappers, demappers, encoders, decoders
- System simulation blocks: Resource grid generation, OFDM modulation/demodulation (for transmission)
- 3GPP-compliant models: Validated channel models and coding schemes
- Sionna does not provide:
- SSB detection functions: No detect_pss(), detect_sss(), or detect_ssb()
- IQ file analysis: No functions to analyze pre-recorded IQ files
- Blind detection algorithms: No correlation-based search for PSS/SSS
- Resource grid extraction from IQ: No functions to extract resource grids from detected signals
- SSB ID detection: No detect_ssb_index() or similar
- High-level analysis tools: No ready-made SSB analysis pipeline
Toolkits for the script
I didn't write the code myself. What I did was just prompting for AI tool and did basic check up for the output. Followings are the tool kits that I used for this script
- Scripting IDE : Cursor
- Version: 2.2.43 (system setup)
- VSCode Version: 1.105.1
- Commit: 32cfbe848b35d9eb320980195985450f244b3030
- Date: 2025-12-19T06:06:44.644Z
- Electron: 37.7.0
- Chromium: 138.0.7204.251
- Node.js: 22.20.0
- V8: 13.8.258.32-electron.0
- OS: Windows_NT x64 10.0.26100
- AI Model : Auto (as of Dec 21, 2025)
- AI Chatbot : Gemini Pro, Chat GPT
- Python Info : Check out this note for the detailed installation proces that I went through
|
==== Python Version ====
3.12.3 (main, Nov 6 2025, 13:44:16) [GCC 13.3.0]
==== Python Executable ====
/home/jaeku/nvidia/venv-sionna/bin/python3
==== Platform Info ====
Linux-6.6.87.2-microsoft-standard-WSL2-x86_64-with-glibc2.39
('main', 'Nov 6 2025 13:44:16')
==== Site-Packages Directories ====
['/home/jaeku/nvidia/venv-sionna/lib/python3.12/site-packages', '/home/jaeku/nvidia/venv-sionna/local/lib/python3.12/dist-packages', '/home/jaeku/nvidia/venv-sionna/lib/python3/dist-packages', '/home/jaeku/nvidia/venv-sionna/lib/python3.12/dist-packages']
==== sys.path ====
/home/jaeku/nvidia
/usr/lib/python312.zip
/usr/lib/python3.12
/usr/lib/python3.12/lib-dynload
/home/jaeku/nvidia/venv-sionna/lib/python3.12/site-packages
==== Installed Packages ====
absl-py == 2.3.1
asttokens == 3.0.1
astunparse == 1.6.3
certifi == 2025.11.12
charset-normalizer == 3.4.4
comm == 0.2.3
contourpy == 1.3.3
cycler == 0.12.1
decorator == 5.2.1
drjit == 1.2.0
executing == 2.2.1
flatbuffers == 25.9.23
fonttools == 4.61.0
gast == 0.7.0
google-pasta == 0.2.0
grpcio == 1.76.0
h5py == 3.15.1
idna == 3.11
importlib_resources == 6.5.2
ipydatawidgets == 4.3.5
ipython == 9.8.0
ipython_pygments_lexers == 1.1.1
ipywidgets == 8.1.8
jedi == 0.19.2
jupyterlab_widgets == 3.0.16
keras == 3.12.0
kiwisolver == 1.4.9
libclang == 18.1.1
Markdown == 3.10
markdown-it-py == 4.0.0
MarkupSafe == 3.0.3
matplotlib == 3.10.7
matplotlib-inline == 0.2.1
mdurl == 0.1.2
mitsuba == 3.7.1
ml_dtypes == 0.5.4
namex == 0.1.0
numpy == 1.26.4
opt_einsum == 3.4.0
optree == 0.18.0
packaging == 25.0
parso == 0.8.5
pexpect == 4.9.0
pillow == 12.0.0
pip == 25.3
prompt_toolkit == 3.0.52
protobuf == 6.33.2
ptyprocess == 0.7.0
pure_eval == 0.2.3
Pygments == 2.19.2
pyparsing == 3.2.5
python-dateutil == 2.9.0.post0
pythreejs == 2.4.2
requests == 2.32.5
rich == 14.2.0
scipy == 1.16.3
setuptools == 80.9.0
sionna == 1.2.1
sionna-rt == 1.2.1
six == 1.17.0
stack-data == 0.6.3
tensorboard == 2.20.0
tensorboard-data-server == 0.7.2
tensorflow == 2.20.0
termcolor == 3.2.0
traitlets == 5.14.3
traittypes == 0.2.3
typing_extensions == 4.15.0
urllib3 == 2.6.0
wcwidth == 0.2.14
Werkzeug == 3.1.4
wheel == 0.45.1
widgetsnbextension == 4.0.15
wrapt == 2.0.1
|
Source Code and Output
You can get the source code for this note here. I would not describe / explain on every single line of the code since AI (e.g, chatGPT, Gemini etc) will explain better than I do.
NOTE : Regarding the I/Q file format
This script uses a raw binary IQ file format that stores complex baseband samples without any header or metadata. The file consists of interleaved I and Q samples, where each I and Q value is stored as a 32-bit floating-point number (float32) in little-endian order. One complex sample is therefore represented by 8 bytes total (4 bytes for I followed by 4 bytes for Q), repeated continuously for the entire capture. You can download an example I/Q file here
that is used for this script.
NOTE : For the script with the capability of PBCH(MIB) decoding as well, try this code here.
Disclaimer !!!
I have checked and fixed some obvious issues of the script while I am prompting the script, but I haven't verified all the details of the implementation. So there likely to be bugs / errors that I missed. So take this purely as an educational purpose for getting some high level idea on how 3GPP NR Phy specification can be implemented
The script output some part of the result in text and some part in graphics.
Followings are the output of the code in text (NOTE : this is the text print with DEBUG=False in the code. You will get the much detailed print when DEBUG=True)
|
(venv-sionna) jaeku@jaeku:~/nvidia$ python3 sionna_iq_ssb_detection.py
2025-12-21 03:28:18.424998: I external/local_xla/xla/tsl/cuda/cudart_stub.cc:31] Could not find cuda drivers on your machine, GPU will not be used.
2025-12-21 03:28:18.444693: I tensorflow/core/util/port.cc:153] oneDNN custom operations are on. You may see slightly different numerical results due to floating-point round-off errors from different computation orders. To turn them off, set the environment variable `TF_ENABLE_ONEDNN_OPTS=0`.
2025-12-21 03:28:19.371921: I tensorflow/core/platform/cpu_feature_guard.cc:210] This TensorFlow binary is optimized to use available CPU instructions in performance-critical operations.
To enable the following instructions: AVX2 AVX_VNNI FMA, in other operations, rebuild TensorFlow with the appropriate compiler flags.
2025-12-21 03:28:22.126246: I tensorflow/core/util/port.cc:153] oneDNN custom operations are on. You may see slightly different numerical results due to floating-point round-off errors from different computation orders. To turn them off, set the environment variable `TF_ENABLE_ONEDNN_OPTS=0`.
2025-12-21 03:28:22.130750: I external/local_xla/xla/tsl/cuda/cudart_stub.cc:31] Could not find cuda drivers on your machine, GPU will not be used.
/home/jaeku/nvidia/sionna_iq_ssb_detection.py:2331: UserWarning: Input data is complex, switching to return_onesided=False
f_spec, t_spec, Sxx = spectrogram(iq_data, fs=sample_rate, nperseg=nperseg_spec,
|
User Interface (GUI) Overview
Followings are the snapshots of graphical output (NOTE : If you want to get images for better resolution, I would suggest you to install the sionna on your PC and run the script that I shared).
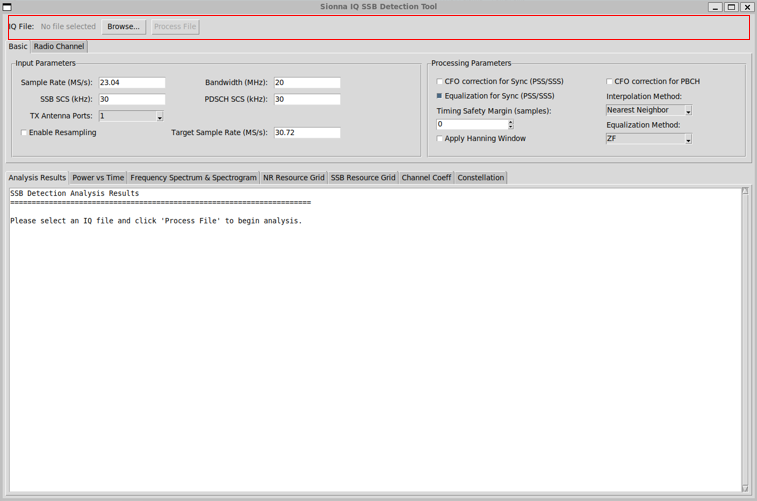
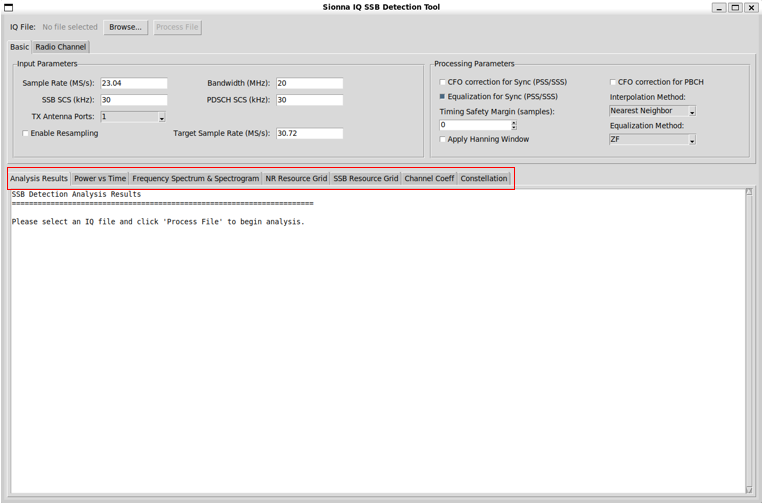
This script provides a Tkinter-based GUI that analyzes 5G NR SSB signals from binary IQ files and shows the results in a tabbed interface. The screen is split into a top configuration area and a bottom visualization notebook, and everything updates when you click Process File.
I/Q File Open/Import
The tool reads binary IQ files and processes them through the SSB detection pipeline. The file selection interface provides a Browse button that opens a standard file dialog to select binary IQ files, with the selected file path displayed in a label next to the button. Once a file is selected, the Process File button becomes enabled, allowing users to initiate the complete analysis pipeline. The file reading functionality supports a specific binary format where IQ samples are stored
as interleaved 4-byte floating-point values, with I and Q components alternating in the file. The processing workflow automatically handles file reading, optional resampling, channel simulation, SSB detection, resource grid extraction, channel estimation, equalization, and visualization updates across all analysis tabs.
Followings are brief descriptions of each part in this view :
-
Browse Button:
-
File Dialog: Filters for binary files (.bin) with option to show all files
-
File Path Display: Shows the selected file name in a label next to the Browse button
-
File Format: Binary format with interleaved 4-byte float I and 4-byte float Q pairs
-
File Reading: Reads entire file as binary data and unpacks as float32 values
-
Data Validation: Ensures even number of samples to form complete I/Q pairs
-
Complex Conversion: Combines I and Q samples into complex IQ array (I + jQ)
-
Process Button State: Automatically enables Process File button when file is selected
-
Process File:
-
Parameter Collection: Reads all configuration parameters from Basic and Radio Channel tabs
-
File Reading: Loads IQ data from selected binary file using read_iq_file() method
-
Resampling: Optionally resamples IQ data to target sample rate if resampling is enabled
-
Channel Simulation: Applies radio channel (NONE/AWGN/TDL/CDL) to raw IQ data before detection
-
SSB Detection: Performs blind PSS/SSS detection with frequency offset search
-
OFDM Extraction: Extracts OFDM symbols with CP removal and FFT conversion
-
Resource Grid Extraction: Maps frequency-domain symbols to resource grid with integer bin shifting
-
SSB ID Detection: Blindly detects SSB index (i_ssb) using differential correlation on PBCH DMRS
-
Channel Estimation: Performs parametric channel estimation with time and frequency slope estimation
-
Channel Interpolation: Interpolates channel estimates from DMRS pilots to all resource elements
-
Equalization: Applies ZF or MMSE equalization to PSS/SSS and PBCH data based on configuration
-
Visualization Updates: Automatically updates all seven analysis tabs with processed results
-
Error Handling: Displays error messages in all tabs if SSB detection fails
-
Debug Output: Provides detailed debug information when DEBUG flag is enabled
-
Status Feedback: Updates GUI elements to reflect processing state and results
Basic Configuration
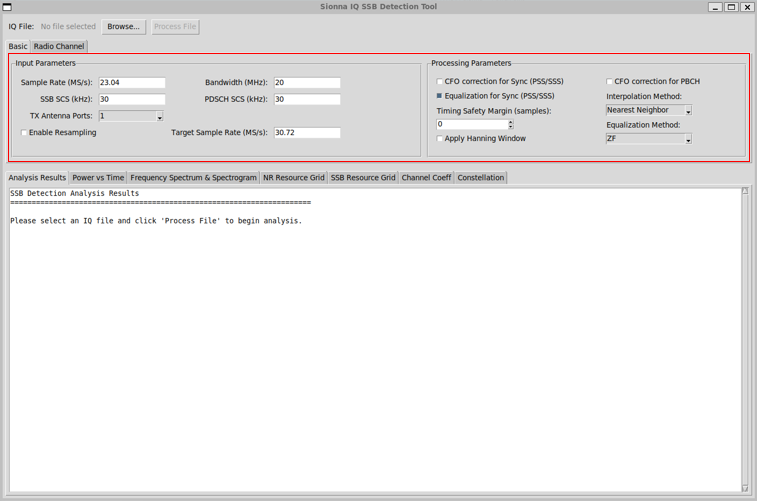
The Basic tab lets you set the core input values such as sample rate, bandwidth, SSB/PDSCH subcarrier spacing, antenna port selection, and optional resampling with a target rate. In the same tab, the processing controls let you configure CFO correction options (for sync signals and PBCH), enable or disable sync-signal equalization, adjust the timing safety margin for OFDM symbol extraction, enable a Hanning window, choose the channel interpolation method (Nearest Neighbor, Linear,
Robust, or Slope-Assisted), and select the equalizer type (ZF or MMSE).
Followings are brief descriptions of each part in this view :
- Input Parameters
- Sample Rate (MS/s): Text entry for sample rate (default: 23.04 MS/s)
- Bandwidth (MHz): Text entry for bandwidth (default: 20 MHz)
- SSB SCS (kHz): Text entry for SSB subcarrier spacing (default: 30 kHz)
- PDSCH SCS (kHz): Text entry for PDSCH subcarrier spacing (default: 30 kHz)
- TX Antenna Ports: Dropdown with options 1, 2, or 4 (default: 1)
- Enable Resampling: Checkbox to enable/disable resampling (default: disabled)
- Target Sample Rate (MS/s): Text entry for target sample rate when resampling is enabled (default: 30.72 MS/s)
- Processing Parameters
- CFO correction for Sync (PSS/SSS): Checkbox to enable CFO correction for synchronization signals (default: disabled; parametric equalization handles CFO)
- Equalization for Sync (PSS/SSS): Checkbox to enable LS interpolation-based equalization for PSS/SSS (default: enabled)
- Timing Safety Margin (samples): Spinbox from -100 to 100 samples to adjust FFT window timing (default: 0; positive shifts earlier into CP, negative shifts later)
- Apply Hanning Window: Checkbox to apply Hanning window for spectral leakage reduction (default: disabled; may cause ICI)
- CFO correction for PBCH: Checkbox to enable CFO correction for PBCH data (default: disabled)
- Interpolation Method: Dropdown with options: "Nearest Neighbor" (default), "Linear", "Robust", "Slope-Assisted"
- Equalization Method: Dropdown with options: "ZF" (Zero Forcing, default) or "MMSE" (Minimum Mean Square Error)
Radio Channel
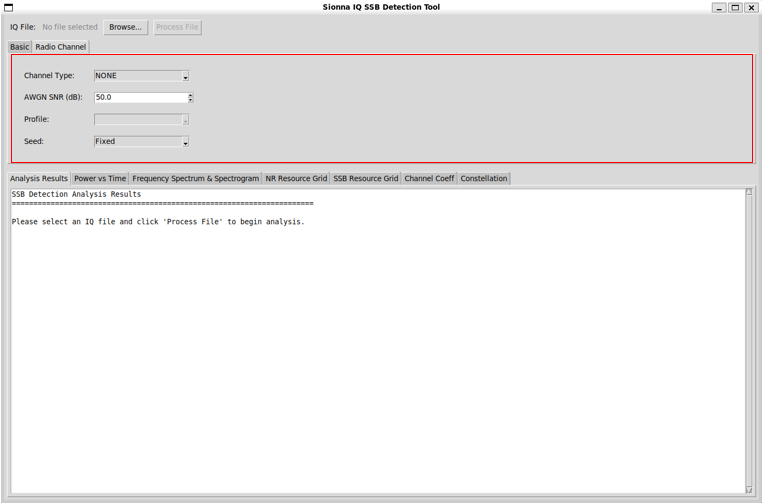
The Radio Channel tab controls channel simulation. You can select NONE, AWGN, TDL, or CDL, and if you pick TDL or CDL the profile list updates to the matching 3GPP profiles (e.g., TDL-A to TDL-E, CDL-A to CDL-E). You can also set AWGN SNR in dB and choose Fixed or Random seed mode for reproducibility.
Followings are brief descriptions of each part in this view :
-
Channel Type
- Selects the radio channel model applied to the signal before SSB detection.
- NONE means no channel impairment is applied and the raw IQ file is processed as-is.
- Other options (when enabled) include AWGN, TDL, or CDL to emulate realistic propagation effects.
-
AWGN SNR (dB)
- Specifies the Signal-to-Noise Ratio in dB when the channel type is set to AWGN.
- Higher values correspond to cleaner signals with less noise.
- This parameter is ignored when Channel Type is set to NONE.
-
Profile
- Selects the predefined channel profile when using multipath channel models such as TDL or CDL.
- Profiles define standardized delay spread and power delay characteristics.
- This field is inactive when the selected Channel Type does not require a profile.
-
Seed
- Controls the random seed used by the channel model.
- Fixed ensures deterministic and repeatable channel behavior across runs.
- Randomized seed options allow statistically independent channel realizations.
Visualization Tabs
The visualization tabs provide multiple views to examine the detected 5G NR SSB signal from different perspectives.
Followings are brief descriptions of each part in this view :
-
Analysis Results
Displays textual results of the SSB detection process, including detection status, timing offset, frequency offset, PCI, and sanity check diagnostics.
-
Power vs Time
Shows the signal power over time, highlighting SSB locations to help verify burst timing and detect power variations or clipping.
-
Frequency Spectrum & Spectrogram
Visualizes the frequency-domain characteristics of the signal using spectrum and time–frequency spectrogram views.
-
NR Resource Grid
Displays the recovered full NR resource grid after OFDM processing, centered on the carrier and aligned to subcarrier spacing.
-
SSB Resource Grid
Shows the extracted SSB-only resource grid, including PSS, SSS, PBCH, and PBCH DMRS regions.
-
Channel Coeff
Visualizes estimated channel coefficients across time and frequency to assess fading and channel consistency.
-
Constellation
Displays constellation diagrams of selected symbols (e.g., PBCH or DMRS) for modulation quality and impairment analysis.
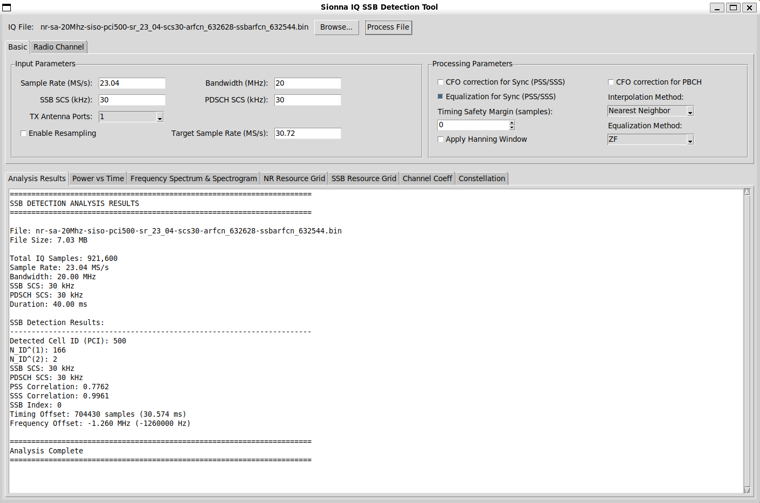
Visualization Tab - Analysis Result
The Analysis Results tab summarizes the key outcomes of the NR receiver processing applied to the selected real IQ file. It reports essential detection information such as file and signal parameters, SSB detection status, identified PCI, synchronization quality metrics, timing offset, and estimated frequency offset. This tab provides a concise, textual overview of whether synchronization and SSB detection were successful and serves as the primary sanity check before examining detailed
visualizations in the other tabs
Followings are brief descriptions of each part in this view :
-
File Information
- Displays the selected IQ file name and file size.
- Confirms that the input is real captured IQ data rather than simulated samples.
-
Basic Signal Parameters
- Shows the effective sample rate, bandwidth, and configured SSB and PDSCH subcarrier spacing.
- Reflects the parameters actually used by the RX processing pipeline.
-
SSB Detection Status
- Indicates whether SSB detection was successful.
- Serves as a primary sanity check before examining other visualization tabs.
-
Detected Cell ID (PCI)
- Reports the detected Physical Cell ID.
- Computed as PCI = 3 × NID1 + NID2 based on PSS and SSS detection.
-
NID2 (PSS Index)
- Identifies the detected PSS sequence index.
- Obtained from peak time-domain PSS correlation among the three candidates.
-
NID1 (SSS Index)
- Identifies the detected SSS sequence index.
- Determined through SSS correlation with time and frequency adjustment around the PSS position.
-
PSS Correlation Metric
- Shows the normalized peak correlation value from the PSS search.
- Used to assess synchronization confidence and reject false detections.
-
SSS Correlation Metric
- Shows the correlation quality of the selected SSS candidate.
- Provides additional confidence for the detected PCI.
-
SSB Index
- Indicates the detected SSB index within the SS burst.
- Derived from timing alignment relative to the NR frame structure.
-
SSB Timing Offset
- Reports the detected SSB start position in samples and equivalent time.
- Used as the reference point for OFDM symbol and resource grid extraction.
-
Estimated Frequency Offset
- Shows the estimated carrier frequency offset in Hz.
- Derived from ARFCN/SSBARFCN parsing or frequency-domain alignment logic in the detection stage.
-
Processing Completion Status
- Confirms that the SSB detection and analysis pipeline completed successfully.
- Indicates that subsequent visualization tabs are populated based on these results.
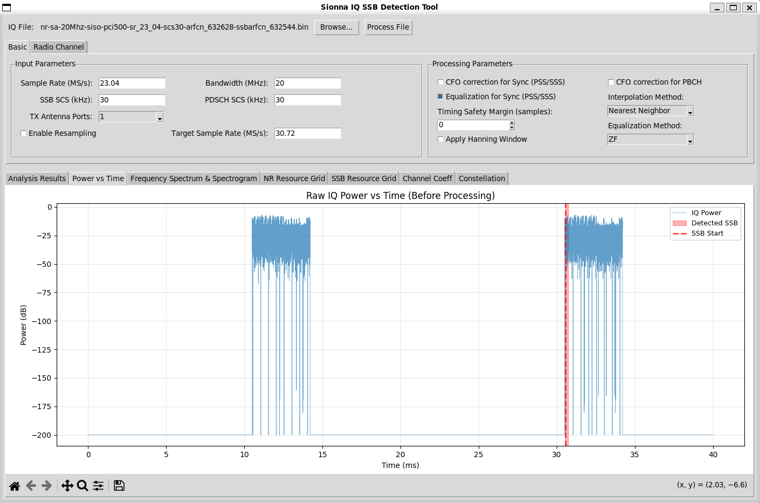
Visualization Tab - Power vs Time
This view provides a high-level overview of the received signal power as a function of time, using the raw IQ samples before detailed NR processing. It allows users to visually identify high-energy regions corresponding to SS burst activity and to verify the detected SSB timing against the actual power profile of the signal. By correlating the detected SSB position with observable power peaks, this plot serves as an intuitive sanity check for synchronization and burst detection
when working with real captured IQ data.
Followings are brief descriptions of each part in this view :
-
Raw IQ Power
- Plots the instantaneous power computed directly from the raw I/Q samples.
- Represents the signal condition before any NR-specific processing or correction.
-
Time Axis
- Displays time in milliseconds derived from the configured sample rate.
- Covers the full duration of the captured IQ file.
-
Power Scale
- Shows signal power in dB.
- Makes burst activity and low-power regions visually distinguishable.
-
Detected SSB Marker
- Indicates the SSB position detected by the PSS/SSS-based synchronization logic.
- Used to verify alignment between algorithmic detection and actual signal energy.
-
SSB Start Indicator
- Marks the estimated start of the detected SSB in time.
- Serves as a reference for subsequent OFDM symbol extraction.
-
Sanity Check Purpose
- Allows quick visual confirmation that SSB detection coincides with real power bursts.
- Helps identify issues such as false detection, clipping, or missing bursts.
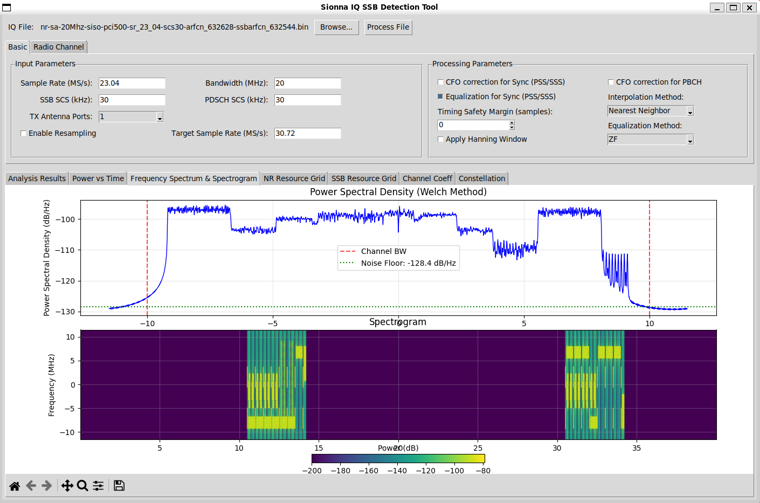
Visualization Tab - Frequency Spectrum & Spectrogram
This view provides a high-level frequency-domain perspective of the received NR signal using both a power spectral density estimate and a time–frequency spectrogram. It allows users to examine the occupied channel bandwidth, noise floor, and spectral shape of the captured IQ data, while also visualizing when and where energy appears in frequency over time. Together, these plots help verify correct signal bandwidth, detect out-of-band emissions or frequency offset, and confirm the
temporal structure of SS burst activity in real measurements.
Followings are brief descriptions of each part in this view :
-
Power Spectral Density (Welch Method)
- Displays the average frequency-domain power of the received signal.
- Computed using the Welch method to reduce variance in the PSD estimate.
-
Frequency Axis
- Shows frequency in MHz relative to the center frequency.
- Allows verification of occupied bandwidth and spectral symmetry.
-
Channel Bandwidth Marker
- Indicates the expected NR channel bandwidth based on user configuration.
- Used to confirm correct capture bandwidth and frequency alignment.
-
Noise Floor Indicator
- Shows the estimated noise floor level in dB/Hz.
- Helps assess signal-to-noise conditions of the captured IQ data.
-
Spectrogram
- Visualizes signal power across frequency and time.
- Reveals when SS burst energy appears within the capture window.
-
Time–Frequency Structure
- Shows bursty NR transmission patterns rather than continuous occupancy.
- Helps identify SSB locations and validate frame timing behavior.
-
Frequency Offset Visibility
- Makes residual frequency offset or drift visually observable.
- Supports sanity checking of frequency correction and capture accuracy.
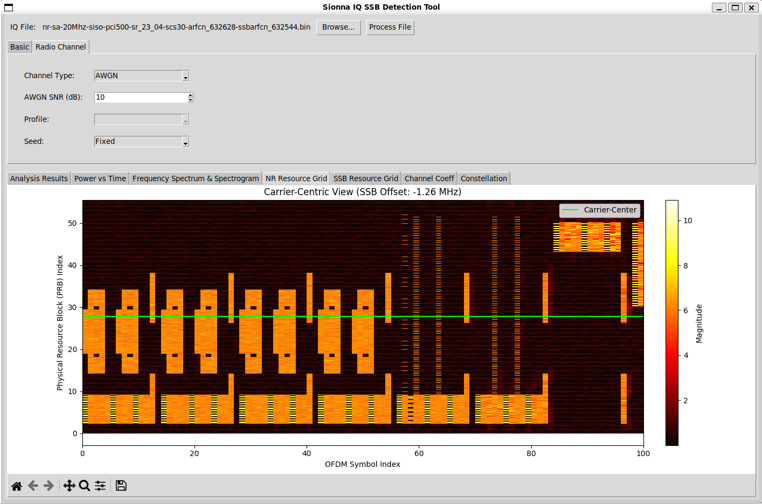
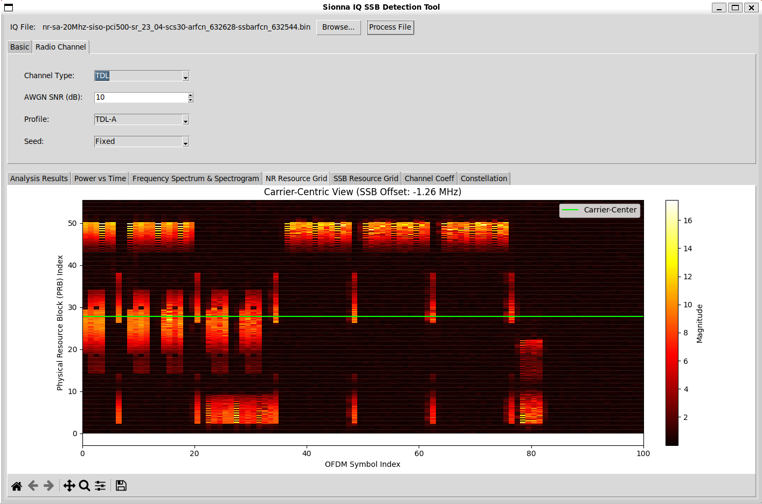
Visualization Tab - NR Resource Grid
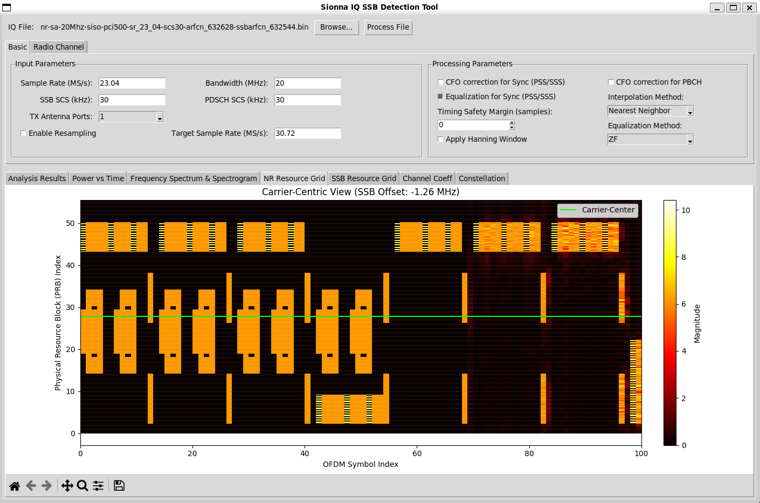
This view presents a carrier-centric NR resource grid reconstructed from real captured IQ data, showing how received energy is mapped across subcarriers and OFDM symbols after synchronization and frequency alignment. By centering the grid on the estimated carrier frequency, it allows users to clearly observe the structure of NR transmissions, including SSB-related regions and other occupied resources, in a format that closely reflects internal receiver processing. This visualization
helps bridge raw IQ samples and logical NR resource allocation, making it easier to understand how practical RX processing recovers the underlying NR signal structure.
Followings are brief descriptions of each part in this view :
-
Carrier-Centric Resource Grid
- Displays the reconstructed NR resource grid centered on the estimated carrier frequency.
- Frequency alignment is applied using the detected frequency offset before grid mapping.
-
Frequency Offset Compensation
- The grid is shifted based on the detected SSB frequency offset (shown in the title).
- Implemented using integer FFT-bin shifting rather than time-domain mixing.
-
Physical Resource Block (PRB) Axis
- Vertical axis represents PRB indices derived from subcarrier spacing and bandwidth.
- Allows direct visualization of how received energy occupies NR PRBs.
-
OFDM Symbol Axis
- Horizontal axis represents OFDM symbol indices over time.
- Shows the temporal structure of NR transmissions within the capture window.
-
Magnitude-Based Visualization
- Color intensity represents the magnitude of received resource elements.
- Helps distinguish active NR resources from noise-only regions.
-
SSB and Burst Visibility
- SSB-related regions appear as concentrated blocks of energy in specific PRB and symbol locations.
- Confirms correct timing and frequency alignment of SSB extraction.
-
Carrier Reference Line
- A reference line marks the estimated carrier center within the grid.
- Used to visually verify symmetry and correct centering of the received signal.
-
Sanity Check for RX Processing
- Provides a direct check that OFDM demodulation and grid extraction worked as expected.
- Helps identify issues such as incorrect FFT size, SCS mismatch, or residual frequency error.
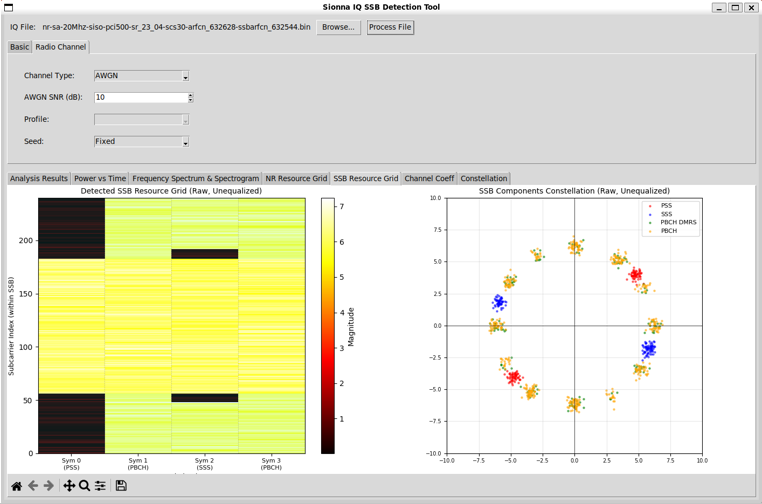
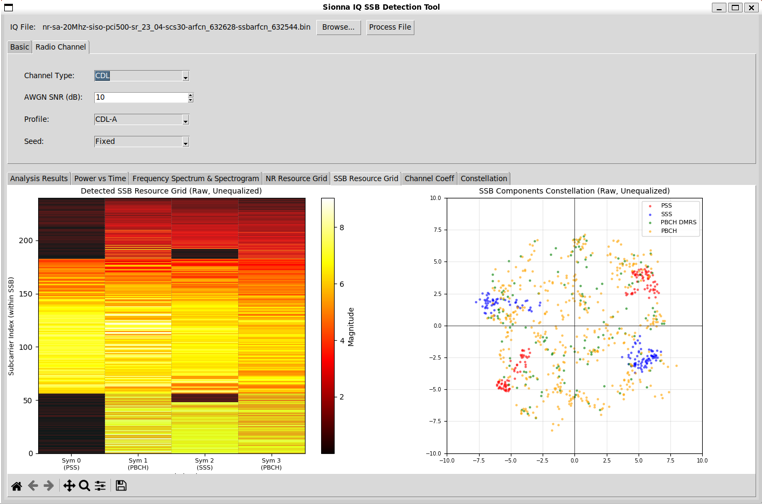
Visualization Tab - SSB Resource Grid
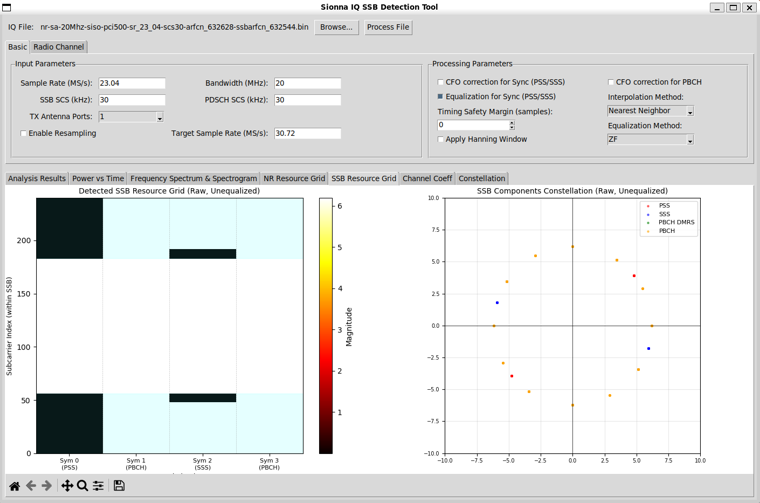
This view focuses on the detected SSB content after synchronization, presenting both the extracted SSB resource grid and the corresponding symbol constellations using real captured IQ data. It allows users to examine how individual SSB components such as PSS, SSS, PBCH, and PBCH DMRS appear at the receiver before equalization, making it easier to understand the raw modulation structure and observe the impact of channel effects, noise, and residual impairments on each SSB elemen
Followings are brief descriptions of each part in this view :
-
Detected SSB Resource Grid
- Displays the extracted SSB-only resource grid after timing and frequency synchronization.
- Includes PSS, SSS, PBCH, and PBCH DMRS regions mapped to their standard locations.
-
Raw, Unequalized View
- Shows the SSB resource grid before channel equalization.
- Reflects the true impact of channel distortion and noise on received symbols.
-
Subcarrier Index Axis
- Vertical axis represents subcarrier indices within the SSB bandwidth.
- Allows inspection of frequency-domain alignment and edge behavior.
-
OFDM Symbol Index
- Horizontal axis represents OFDM symbols corresponding to the SSB structure.
- Separates PBCH, PSS, and SSS symbols in time.
-
Magnitude-Based Grid Coloring
- Color intensity represents the magnitude of each received resource element.
- Highlights active SSB components against noise-only regions.
-
SSB Component Constellations
- Plots constellation points for individual SSB components.
- Different markers and colors distinguish PSS, SSS, PBCH, and PBCH DMRS symbols.
-
Pre-Equalization Behavior
- Constellations show symbol rotation and spreading caused by channel effects.
- Useful for diagnosing frequency offset, phase noise, and multipath distortion.
-
Sanity Check for SSB Extraction
- Confirms correct SSB timing, frequency alignment, and symbol mapping.
- Helps detect issues such as incorrect FFT bin alignment or symbol indexing.
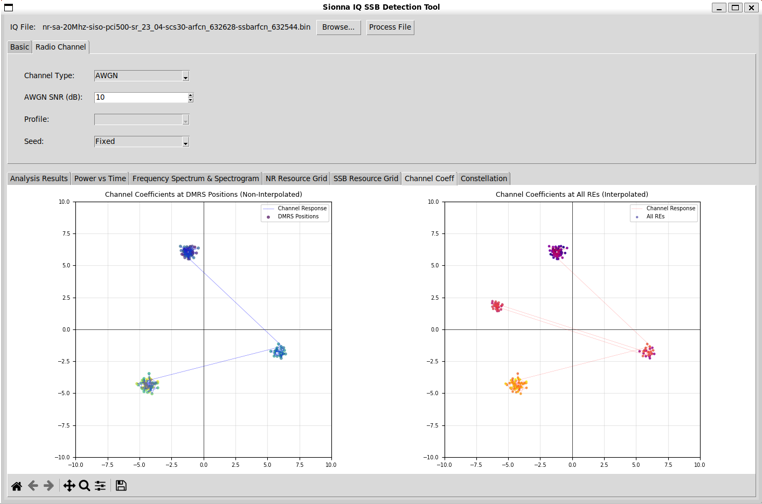
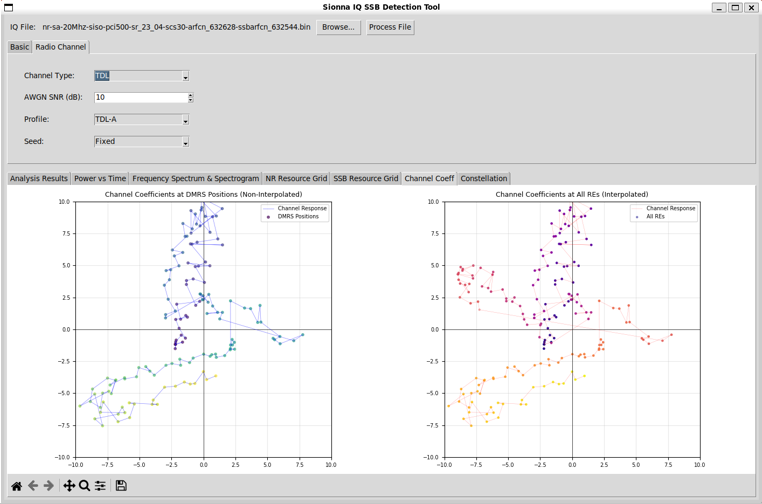
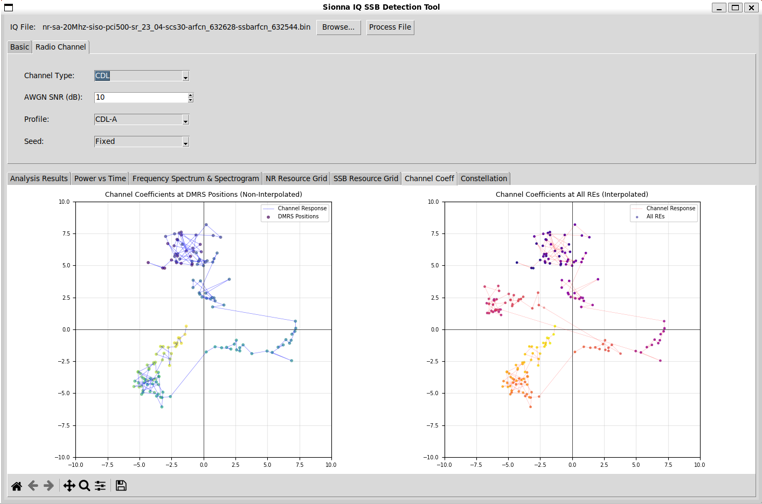
Visualization Tab - Channel Coefficient
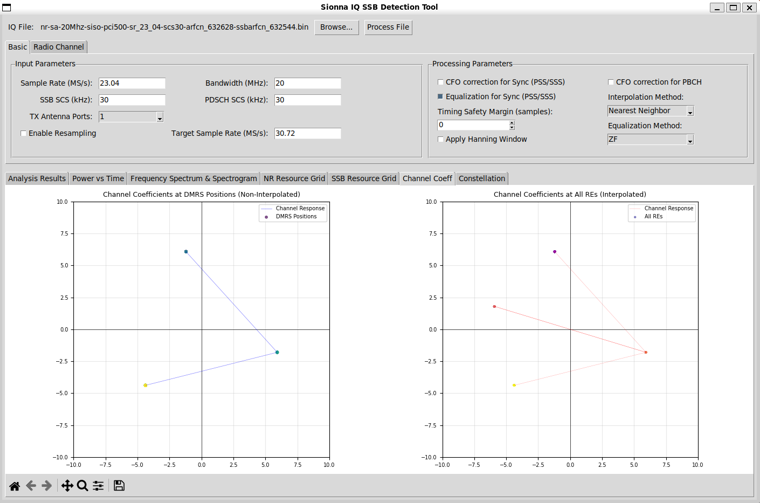
This view visualizes the estimated channel response derived from the detected SSB, showing how the radio channel affects the received signal in the complex plane. It presents channel coefficients first at the PBCH DMRS positions and then after interpolation across all relevant resource elements, allowing users to observe channel amplitude and phase behavior. This high-level view helps illustrate how channel estimation works in a practical NR receiver and provides insight into fading
characteristics, phase rotation, and the effectiveness of interpolation when processing real captured IQ data.
Followings are brief descriptions of each part in this view :
-
Channel Coefficients at DMRS Positions
- Shows the raw channel estimates obtained directly from PBCH DMRS symbols.
- Each point represents the complex channel response at a DMRS resource element.
- Reflects the most reliable channel measurements before any interpolation.
-
Non-Interpolated Channel View
- Visualizes channel coefficients only at DMRS locations.
- Highlights sparsity of pilot-based channel knowledge in time and frequency.
- Useful for understanding pilot density and raw estimation quality.
-
Interpolated Channel Coefficients
- Displays channel estimates extended to all relevant resource elements.
- Computed using the selected interpolation method (e.g., nearest neighbor).
- Represents the channel model actually used for equalization.
-
Complex Plane Representation
- Plots channel coefficients in the I/Q (real–imaginary) plane.
- Vector direction indicates phase rotation introduced by the channel.
- Vector length reflects channel gain or attenuation.
-
Channel Consistency Check
- Similar angles and magnitudes across points indicate a stable channel.
- Large spread suggests frequency selectivity or phase instability.
-
Relation to Equalization
- The interpolated channel coefficients are later used for symbol equalization.
- Provides insight into how accurately the receiver can compensate channel effects.
-
Practical RX Insight
- Helps visualize real-world fading and phase distortion from captured IQ data.
- Useful for debugging channel estimation, interpolation choices, and residual impairments.
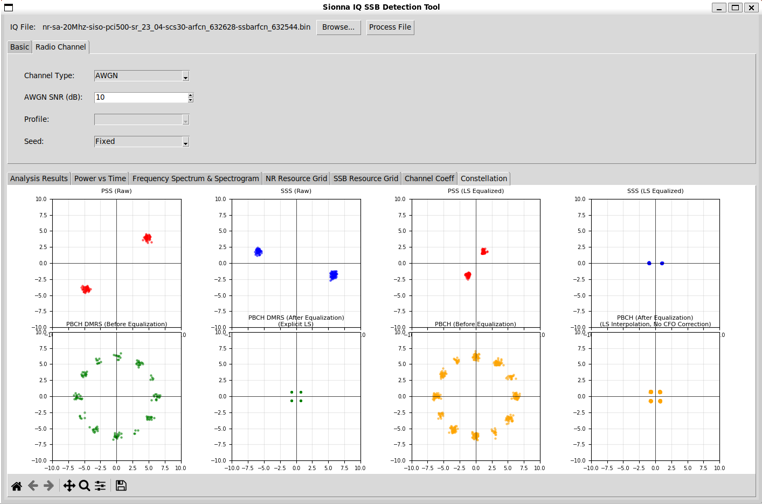
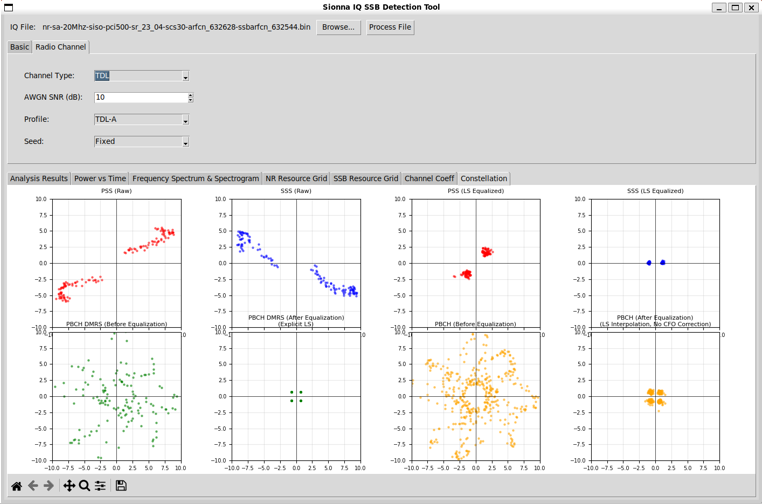
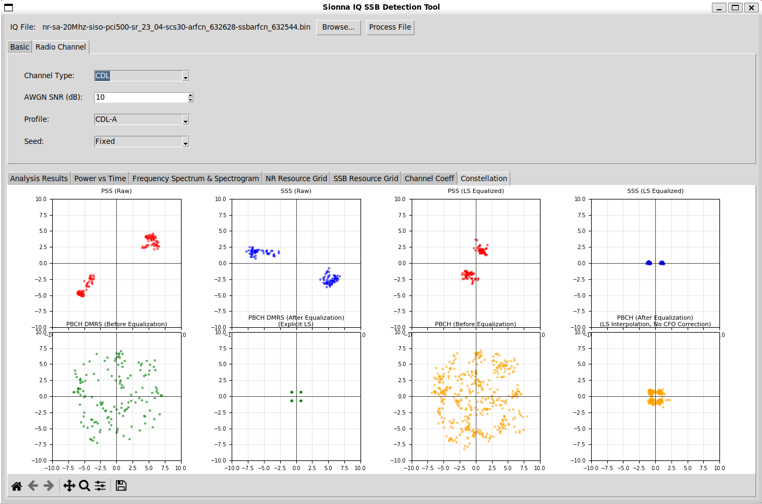
Visualization Tab - Constellation
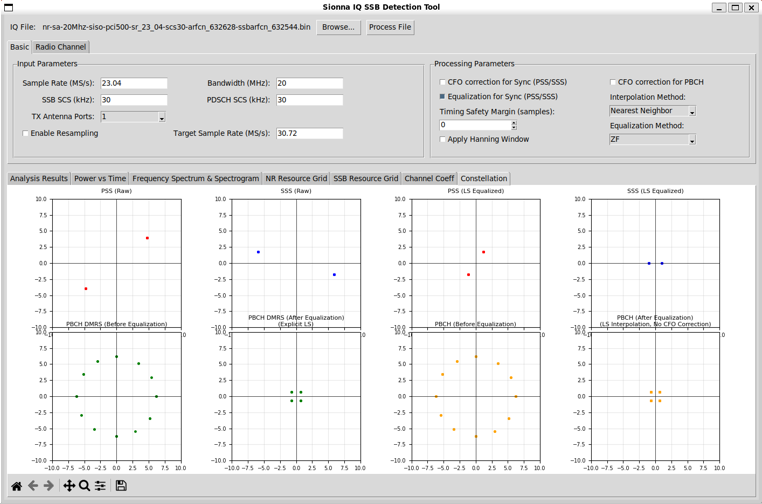
This view presents a constellation-based breakdown of key SSB components, showing how synchronization signals and PBCH symbols appear in the complex plane before and after receiver processing. By comparing raw constellations with their equalized counterparts, it illustrates the impact of channel estimation, interpolation, and frequency offset correction on real captured IQ data. This visualization helps users understand how NR receiver algorithms progressively transform distorted
received symbols into well-aligned constellations suitable for reliable decoding.
Followings are brief descriptions of each part in this view :
-
PSS Constellation (Raw)
- Shows the received PSS symbols plotted in the complex plane before any equalization.
- Illustrates the effect of channel phase rotation and noise on synchronization symbols.
-
SSS Constellation (Raw)
- Displays raw SSS symbols prior to channel compensation.
- Used to visually confirm SSS detection quality and phase consistency.
-
PSS Constellation (LS Equalized)
- Shows PSS symbols after least-squares channel equalization.
- Demonstrates removal of dominant channel-induced phase and amplitude distortion.
-
SSS Constellation (LS Equalized)
- Displays SSS symbols after equalization.
- Improved clustering indicates effective channel estimation.
-
PBCH DMRS (Before Equalization)
- Shows PBCH DMRS symbols as received, prior to channel correction.
- Provides a direct view of pilot distortion caused by the radio channel.
-
PBCH DMRS (After Equalization)
- Displays PBCH DMRS symbols after LS channel equalization.
- Used to verify channel estimation accuracy and interpolation performance.
-
PBCH Data (Before Equalization)
- Shows PBCH QPSK data symbols prior to equalization.
- Constellation spreading reflects combined channel and frequency offset effects.
-
PBCH Data (After Equalization)
- Displays PBCH symbols after channel equalization and optional CFO correction.
- Improved symbol clustering indicates readiness for PBCH demodulation.
-
Processing Progression Insight
- Left-to-right and top-to-bottom views illustrate successive RX processing stages.
- Helps correlate algorithmic processing steps with observable constellation improvement.
-
Practical Debugging Aid
- Allows visual identification of residual phase error, noise, or equalization issues.
- Useful for tuning CFO correction, interpolation methods, and equalization settings.
Advanced Test - AWGN
This view shows the carrier-centric NR resource grid after applying an AWGN channel to the real captured IQ data, illustrating how additive noise affects the received signal structure. While the overall NR transmission pattern and SSB-related regions remain visible, the presence of noise raises the background level and reduces the contrast between active resources and noise-only regions. This visualization helps users understand the impact of AWGN on practical receiver processing
and assess the robustness of synchronization, frequency alignment, and resource grid reconstruction under degraded signal-to-noise conditions.
This view presents the detected SSB resource grid and corresponding constellations when an AWGN channel is applied to the real captured IQ data. The added noise raises the overall magnitude level in the resource grid and causes noticeable spreading of constellation points for PSS, SSS, PBCH, and PBCH DMRS symbols. By comparing this view with the noise-free case, users can directly observe how reduced SNR impacts SSB visibility, symbol clustering, and overall receiver performance
in a controlled but realistic impairment scenario.
This view illustrates the estimated channel coefficients under an AWGN-impaired condition, derived from the detected SSB using real captured IQ data. The left plot shows channel estimates obtained directly at PBCH DMRS positions, while the right plot presents the interpolated channel response across all relevant resource elements. Compared to a clean channel case, the presence of AWGN causes increased scattering of channel estimates in the complex plane, making noise effects directly
visible. This visualization helps users understand how noise impacts channel estimation quality, interpolation behavior, and the reliability of subsequent equalization in a practical NR receiver.
This view shows the constellation behavior of SSB-related signals under an AWGN-impaired condition, using real captured IQ data with controlled noise added. It compares raw and equalized constellations for PSS, SSS, PBCH DMRS, and PBCH data, making the impact of noise clearly visible as increased symbol spread and reduced clustering. By observing how equalization partially restores constellation alignment despite AWGN, this view helps users understand the effect of SNR on synchronization
signals, channel estimation accuracy, and PBCH symbol quality in a practical NR receiver.
Advanced Test - TDL
This view shows the carrier-centric NR resource grid when a multipath fading channel (TDL-A) is applied to the real captured IQ data. Unlike the AWGN case, the signal energy is unevenly distributed across time and frequency due to delay spread and frequency-selective fading introduced by the TDL channel. Variations in magnitude across PRBs and OFDM symbols reflect multipath interference and constructive or destructive combining of signal components. This visualization helps illustrate
how realistic propagation effects distort the NR resource grid and why accurate channel estimation and equalization are essential for reliable receiver performance in practical radio environments.
This view presents the detected SSB resource grid and corresponding constellations when a multipath fading channel (TDL-A) is applied to the real captured IQ data. The resource grid shows significant variation in magnitude across subcarriers and symbols due to delay spread and frequency-selective fading, while the constellation plot exhibits heavy spreading and distortion of PSS, SSS, PBCH, and PBCH DMRS symbols. Together, these visualizations highlight how realistic multipath
propagation impacts SSB integrity and symbol coherence, and they illustrate why robust channel estimation and equalization are critical in practical NR receiver implementations operating over time-dispersive channels.

This view illustrates the estimated channel response under a multipath fading environment (TDL-A), derived from the detected SSB using real captured IQ data. The left plot shows raw channel estimates at PBCH DMRS positions, revealing how multipath components introduce rapid phase variation and amplitude fluctuation across pilots. The right plot shows the interpolated channel response across all relevant resource elements, highlighting how the receiver reconstructs a continuous
channel model from sparse pilot measurements. Compared to AWGN conditions, the extended and curved trajectories in the complex plane clearly demonstrate the impact of delay spread and frequency selectivity, providing an intuitive view of why channel interpolation and equalization are critical in practical NR receivers operating over realistic multipath channels.
This view presents the constellation behavior of SSB-related signals under a realistic multipath fading channel (TDL-A), using real captured IQ data with controlled channel impairment applied. It compares raw and equalized constellations for PSS, SSS, PBCH DMRS, and PBCH data, making the effects of delay spread and frequency-selective fading clearly visible as symbol elongation, rotation, and dispersion in the complex plane. By observing how least-squares channel estimation and
interpolation partially restore symbol clustering, this view illustrates both the severity of multipath distortion and the role of equalization in enabling reliable NR receiver operation in practical propagation environments.
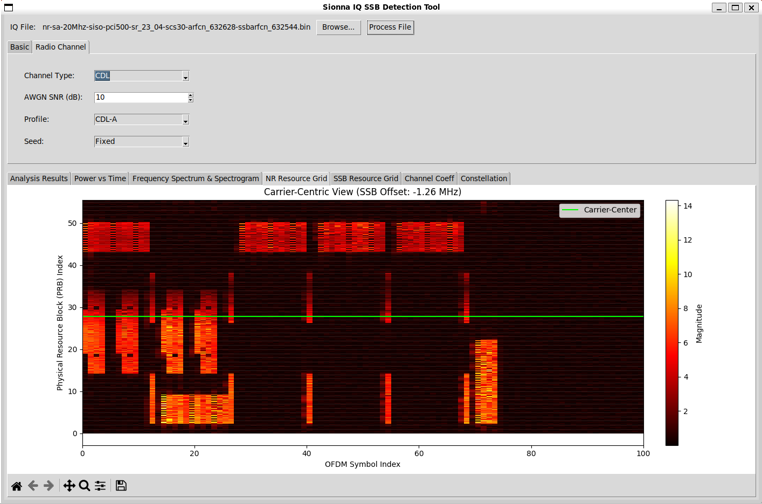
Advanced Test - CDL
This view shows the carrier-centric NR resource grid when a clustered delay line (CDL-A) channel model is applied to the real captured IQ data. Compared to AWGN and simple TDL cases, the CDL channel introduces more complex spatial and multipath effects, resulting in structured but irregular variations of signal magnitude across PRBs and OFDM symbols. The grid highlights how clustered multipath propagation distorts the received NR signal in both time and frequency, while still preserving
the overall transmission pattern. This visualization helps users understand the impact of realistic 3GPP CDL channel conditions on resource grid reconstruction and illustrates the increased challenge faced by channel estimation and equalization in practical NR receiver implementations.
This view presents the detected SSB resource grid and corresponding constellations under a clustered delay line (CDL-A) channel condition, applied to real captured IQ data. The resource grid shows pronounced variation in magnitude across subcarriers and symbols due to clustered multipath propagation, while the constellation plot exhibits significant dispersion and distortion of PSS, SSS, PBCH, and PBCH DMRS symbols. Compared to AWGN and simpler TDL channels, the CDL channel introduces
more complex fading behavior, making the impact of realistic 3GPP propagation conditions clearly visible. This view helps illustrate how clustered multipath affects SSB integrity and why robust channel estimation and equalization are essential for reliable NR receiver operation in practical environments.
This view illustrates the estimated channel response under a clustered delay line (CDL-A) propagation model, derived from the detected SSB using real captured IQ data. The left plot shows raw channel estimates at PBCH DMRS positions, revealing how clustered multipath components produce complex, non-uniform phase and amplitude variations. The right plot shows the interpolated channel response across all relevant resource elements, highlighting how the receiver reconstructs a continuous
channel representation from sparse pilot measurements. Compared to AWGN and simpler TDL cases, the CDL channel produces more intricate and spatially separated trajectories in the complex plane, providing an intuitive visualization of realistic 3GPP channel behavior and its impact on channel estimation and equalization in practical NR receivers.
This view presents the constellation behavior of SSB-related signals under a clustered delay line (CDL-A) channel condition, using real captured IQ data with realistic multipath propagation applied. It compares raw and equalized constellations for PSS, SSS, PBCH DMRS, and PBCH data, clearly showing how clustered multipath causes symbol dispersion, rotation, and non-uniform distortion in the complex plane. The improvement seen after channel estimation, interpolation, and equalization
highlights how the receiver mitigates complex CDL effects, while also revealing the residual impairments that make CDL channels more challenging than AWGN or simple TDL models in practical NR receiver operation.
Source Code Overview
Even though I no longer need to describe every single line of code in the age of AI, I still think it is valuable to write down some key points. This is not to show off the code itself. It is to record the intention behind the script. I want to clarify what I was trying to do, what kind of idea I had in mind, and what kind of problems this script is designed to solve. This allows the reader to connect the final result with the original design goal. It also helps me later when I come back to
this code after a long time and forget my own thinking process.
You may not need all of these details if your only goal is to understand the output of the script. For simple usage, you can often treat the script as a black box. You run it. You look at the result. You move on. In many cases this is enough. However, if you want to modify, revise, or extend the script for your own purpose, the situation changes. You would need to know which part of the code is doing what. You would need to know which parameters control which behavior. You would also need to
know what kind of assumptions I made when I first wrote the code. In that case, a clear description of the code is not a luxury. It becomes a kind of map.
One of the best ways to learn anything related to programming is still very old-fashioned. You break it and then you fix it. You change a small part of the script and see what goes wrong. You check the error. You adjust. You run it again. This loop may look inefficient at first, but it forces your brain to connect cause and effect inside the code. So my intention with these explanations is not just to document the script. It is to give you enough context so that you can safely break it, understand
why it broke, and then fix it in a way that matches your own idea. This process is painful sometimes, but it is also the part that makes the knowledge stick to your brain.
Key Features
-
Blind SSB Detection
- PSS Detection: Time-domain correlation search without prior cell ID knowledge, using brute-force frequency scanning across the bandwidth in steps of SSB subcarrier spacing.
- SSS Detection: Matrix search performed after PSS detection to identify nid_1 (0–335) and derive the full Cell ID (PCI = 3 × nid_1 + nid_2).
- Timing Offset Detection: Automatic estimation of symbol timing based on the PSS correlation peak.
- Frequency Offset Estimation: Estimation of carrier frequency offset from PSS correlation results for subsequent compensation.
- SSB ID Detection: Blind detection of SSB index (issb, 0–7) using differential correlation on PBCH DMRS sequences.
- Full File Scanning: Entire IQ file is scanned to ensure SSBs are detected even when the capture starts with silence.
- Smart Frequency Search: Uses ARFCN information parsed from the filename when available, otherwise falls back to exhaustive frequency search.
-
Frequency Offset Handling
- Integer Bin Calculation: Converts the detected frequency offset into an integer FFT-bin offset based on subcarrier spacing.
- Frequency-Domain Correction: Applies frequency correction during resource grid extraction rather than time-domain mixing.
- Quality Preservation: Preserves signal integrity by avoiding interpolation artifacts.
- No Scalloping Loss: Eliminates scalloping loss and circular convolution artifacts associated with time-domain frequency shifts.
-
Radio Channel Simulation
- NONE Mode: Pass-through option with no channel applied for analyzing raw IQ data.
- AWGN Channel: Additive White Gaussian Noise with configurable SNR (−20 to 100 dB, default 50 dB), implemented using NumPy.
- TDL Channel: Tapped Delay Line channel with 3GPP profiles (A/B/C/D/E), using Sionna API when available or a custom fallback.
- CDL Channel: Clustered Delay Line channel with 3GPP profiles (A/B/C/D/E), using Sionna API when available or a custom fallback.
- Seed Control: Fixed mode for reproducible results or Random mode for varying channel realizations.
- Channel Application Timing: Channel effects are applied to raw IQ data before any detection or processing steps.
- Automatic Fallback: Gracefully switches to custom channel implementation if the Sionna API is unavailable or fails.
-
Interactive GUI
- File Selection: Browse button with file dialog for selecting binary IQ files (*.bin).
- Parameter Configuration: Two-tab configuration interface (Basic and Radio Channel) with organized parameter panels.
- Real-Time Updates: Automatic refresh of constellation plots when processing options change.
- Process Button: Single-click execution of the full analysis pipeline with synchronized updates across all tabs.
- Error Handling: Comprehensive error reporting across all tabs when SSB detection fails.
- Status Feedback: File path display and button state management for clear user guidance.
-
Multi-Tab Visualization
- Analysis Results Tab: Scrollable text output showing file information, detection statistics, correlation metrics, timing and frequency offsets, and SSB index.
- Power vs Time Tab: Time-domain power plot with optional SSB timing markers.
- Frequency Spectrum & Spectrogram Tab: Welch PSD and time–frequency spectrogram for signal characterization.
- NR Resource Grid Tab: Full resource grid heatmap with frequency annotations and magnitude-based coloring.
- SSB Resource Grid Tab: SSB-specific view with resource grid heatmap and component constellation plots.
- Channel Coeff Tab: Visualization of channel estimates at DMRS positions and interpolated responses.
- Constellation Tab: 2×4 grid showing PSS, SSS, PBCH, and DMRS constellations before and after equalization.
- Interactive Toolbars: Matplotlib navigation toolbars for zooming, panning, and saving plots.
-
Configurable Parameters
- Input Parameters: Sample rate, bandwidth, SSB SCS, PDSCH SCS, TX antenna ports, and optional resampling with target sample rate.
- Processing Parameters: CFO correction options, equalization enablement, timing safety margin, Hanning window, interpolation method, and equalization method (ZF/MMSE).
- Channel Parameters: Channel type, AWGN SNR, profile selection, and seed mode.
- Dynamic UI: Profile options automatically enabled and populated based on selected channel type.
-
3GPP-Compliant
- PSS and SSS sequence generation fully compliant with 3GPP TS 38.211.
Fully Implemented
|
Feature
|
Description
|
3GPP Reference
|
|
PSS Sequence Generation
|
BPSK sequence generation for nid_2 (0, 1, 2)
|
TS 38.211 Section 7.4.2.2.1
|
|
SSS Sequence Generation
|
BPSK sequence generation for nid_1 (0–335)
|
TS 38.211 Section 7.4.2.3.1
|
|
Blind PSS Detection
|
FFT-based correlation for PSS detection
|
TS 38.211
|
|
Blind SSS Detection
|
Correlation-based SSS detection after PSS
|
TS 38.211
|
|
Cell ID Detection
|
Full PCI (NCELL_ID) detection from PSS and SSS
|
TS 38.211
|
|
Frequency Offset Detection
|
Frequency offset estimation derived from PSS correlation
|
-
|
|
Integer Bin Shifting
|
Frequency-domain FFT bin shifting for offset compensation
|
-
|
|
OFDM Symbol Extraction
|
Cyclic prefix removal and FFT-based OFDM symbol extraction
|
-
|
|
Resource Grid Extraction
|
Full NR resource grid extraction with frequency alignment
|
-
|
|
SSB Resource Grid Extraction
|
SSB-specific grid extraction (4 symbols, 240 subcarriers)
|
TS 38.211 Section 7.4.3
|
|
IQ File Reading
|
Binary IQ file parsing (4-byte float I/Q pairs)
|
-
|
|
Resampling
|
Optional resampling to a target sample rate
|
-
|
|
AWGN Channel
|
Additive White Gaussian Noise channel model
|
-
|
|
TDL Channel
|
Tapped Delay Line channel with configurable profiles (A/B/C/D/E).
Uses Sionna API if available, otherwise a custom fallback implementation.
|
TS 38.901
|
|
CDL Channel
|
Clustered Delay Line channel with configurable profiles (A/B/C/D/E).
Uses Sionna API if available, otherwise a custom fallback implementation.
|
TS 38.901
|
|
Channel Seed Control
|
Fixed or Random seed mode for reproducible or varying channel realizations
|
-
|
|
Power vs Time Visualization
|
Time-domain power analysis of raw IQ samples
|
-
|
|
Spectrum Analysis
|
Welch PSD and time–frequency spectrogram visualization
|
-
|
|
Resource Grid Visualization
|
Full NR resource grid heatmap with frequency annotations
|
-
|
|
SSB Resource Grid Visualization
|
SSB-specific grid visualization with PSS, SSS, PBCH, and DMRS annotations
|
TS 38.211
|
|
Channel Coefficient Visualization
|
Channel magnitude and phase visualization in the complex plane
|
-
|
|
Constellation Visualization
|
Scatter plots for PSS, SSS, PBCH, and DMRS symbols
|
-
|
|
Interactive GUI
|
Tkinter-based graphical user interface with tabbed views
|
-
|
|
Parameter Configuration
|
Tabbed parameter settings for Basic and Radio Channel options
|
-
|
Partially Implemented
|
Feature
|
Status
|
Notes
|
|
Sionna TDL/CDL Models
|
Optional with Fallback
|
Works without Sionna: Uses Sionna’s 3GPP-compliant channel models when available
(preferred path). If Sionna is not installed or fails, the tool automatically falls back
to a custom implementation. Full functionality is maintained without Sionna.
|
|
PBCH Decoding
|
Not implemented
|
PBCH symbols are extracted and visualized, but BCH/MIB decoding is not performed.
|
|
Multi-SSB Detection
|
Single SSB
|
Detects one SSB instance at a time. Multi-SSB burst detection and tracking are not implemented.
|
Not Implemented
|
Feature
|
Description
|
3GPP Reference
|
|
PBCH Decoding
|
BCH channel decoding and extraction of MIB information from PBCH symbols
|
TS 38.212
|
|
PBCH Descrambling
|
Generation and application of the PBCH descrambling sequence
|
TS 38.211 Section 7.3.3
|
|
Multi-SSB Burst Detection
|
Detection and handling of multiple SSBs within a single SS burst
|
TS 38.213
|
|
SSB Time Pattern
|
Detection and interpretation of SSB time patterns (Case A–E)
|
TS 38.213 Section 4.1
|
|
Channel Estimation
|
Estimation of channel response using DMRS symbols
|
TS 38.211
|
|
Equalization
|
Frequency-domain equalization to compensate channel effects
|
-
|
|
Timing Synchronization
|
Fine timing offset estimation beyond coarse PSS-based synchronization
|
-
|
|
Multi-Antenna Processing
|
MIMO detection and processing for multi-antenna NR receivers
|
TS 38.211
|
Description of Parameters (Global Variables)
Basic Parameters (Basic Tab)
|
Parameter
|
Type
|
Default
|
Description
|
|
Sample Rate (MS/s)
|
float
|
23.04
|
Sample rate in mega-samples per second
|
|
Bandwidth (MHz)
|
float
|
20
|
Channel bandwidth in megahertz
|
|
SSB SCS (kHz)
|
float
|
30
|
SSB subcarrier spacing in kilohertz
|
|
PDSCH SCS (kHz)
|
float
|
30
|
PDSCH subcarrier spacing in kilohertz
|
|
TX Antenna Ports
|
str
|
"1"
|
Number of transmit antenna ports (1, 2, or 4)
|
|
Resampling Enabled
|
bool
|
False
|
Enable or disable resampling to a target sample rate
|
|
Target Sample Rate (MS/s)
|
float
|
23.04
|
Target sample rate used when resampling is enabled
|
Radio Channel Parameters (Radio Channel Tab)
|
Parameter
|
Type
|
Default
|
Description
|
|
Channel Type
|
str
|
"NONE"
|
Channel type selection: NONE, AWGN, TDL, or CDL
|
|
AWGN SNR (dB)
|
float
|
50.0
|
Signal-to-noise ratio for AWGN (range: −20 to 100 dB)
|
|
Profile
|
str
|
""
|
Channel profile for TDL or CDL models.
Automatically populated based on selected Channel Type.
|
|
Seed
|
str
|
"Fixed"
|
Seed mode for channel generation: Fixed (reproducible) or Random
|
Channel Type Options
- NONE: No channel applied. Original IQ data is processed without impairment.
- AWGN: Additive White Gaussian Noise channel only.
- TDL: Tapped Delay Line channel with AWGN, compliant with 3GPP TR 38.901.
- CDL: Clustered Delay Line channel with AWGN, compliant with 3GPP TR 38.901.
Profile Options
- TDL Profiles
- TDL-A
- TDL-B
- TDL-C
- TDL-D
- TDL-E
- Profiles differ in delay spread, number of taps, and power decay characteristics.
- CDL Profiles
- CDL-A
- CDL-B
- CDL-C
- CDL-D
- CDL-E
- Profiles differ in cluster structure and multipath propagation behavior.
Description of Functions
generate_pss_sequence(n_id_2)
Generates the PSS (Primary Synchronization Signal) sequence according to
3GPP TS 38.211 Section 7.4.2.2.1.
Parameters
n_id_2 (int): Physical layer cell identity group (0, 1, or 2)
Returns
np.ndarray: PSS sequence (127 complex BPSK values)
generate_sss_sequence(n_id_1, n_id_2)
Generates the SSS (Secondary Synchronization Signal) sequence according to
3GPP TS 38.211 Section 7.4.2.3.1.
Parameters
n_id_1 (int): Physical layer cell identity (0–335)n_id_2 (int): Physical layer cell identity group (0, 1, or 2)
Returns
np.ndarray: SSS sequence (127 complex BPSK values)
detect_pss_simple(iq_data, sample_rate, bandwidth, scs_khz=30)
Detects the PSS using FFT-based correlation over the received IQ samples.
Parameters
iq_data (np.ndarray): Time-domain IQ samplessample_rate (float): Sample rate in Hzbandwidth (float): Channel bandwidth in Hzscs_khz (float): Subcarrier spacing in kHz (default: 30)
Returns
-
dict: Detection results including
n_id_2, peak_index,
correlation, and n_fft
detect_pci_full(iq_data, sample_rate, bandwidth, scs_khz=30, filename=None)
Performs full PCI detection including PSS and SSS detection with frequency
offset estimation.
Parameters
iq_data (np.ndarray): Time-domain IQ samplessample_rate (float): Sample rate in Hzbandwidth (float): Channel bandwidth in Hzscs_khz (float): Subcarrier spacing in kHz (default: 30)filename (str, optional): Filename used for frequency offset parsing
Returns
-
dict: Detection results including
n_cell_id, n_id_1, n_id_2,
timing_offset, frequency_offset_hz, and related metrics
Features
- Blind frequency search across the configured bandwidth
- PSS detection using correlation metrics
- SSS detection performed after successful PSS detection
- Frequency offset estimation
- Internal frequency correction applied during detection
Resource Grid Extraction Functions
extract_resource_grid(ofdm_symbols, detection_result, sample_rate, bandwidth, scs_khz=30)
Extracts the NR OFDM resource grid from detected symbols using integer
FFT-bin shifting.
Parameters
ofdm_symbols (list): List of OFDM symbols (time-domain, including CP)detection_result (dict): Output from detect_pci_fullsample_rate (float): Sample rate in Hzbandwidth (float): Channel bandwidth in Hzscs_khz (float): Subcarrier spacing in kHz (default: 30)
Returns
-
np.ndarray: Complex resource grid
(num_symbols × num_subcarriers)
Features
- Integer FFT-bin shifting for frequency offset correction
- Cyclic prefix removal and FFT processing
- Frequency-domain alignment
- Windowed extraction around the detected signal center
Channel Functions
apply_radio_channel(iq_data, sample_rate, bandwidth, scs_khz,
channel_type, channel_profile, awgn_snr_db, seed_mode="Fixed")
Applies a configurable radio channel model to the raw IQ data before any
NR receiver processing.
Parameters
iq_data (np.ndarray): Raw complex IQ samplessample_rate (float): Sample rate in Hzbandwidth (float): Channel bandwidth in Hzscs_khz (float): Subcarrier spacing in kHzchannel_type (str): "NONE", "AWGN", "TDL", or "CDL"channel_profile (str): Channel profile (e.g., "TDL-A", "CDL-B")awgn_snr_db (float): AWGN SNR in dBseed_mode (str): "Fixed" or "Random" (default: "Fixed")
Returns
np.ndarray: IQ data after channel application
Features
- NONE mode returns original IQ data unchanged
- AWGN mode applies additive white Gaussian noise only
- TDL/CDL mode applies fading channel followed by AWGN
- Frequency-domain channel application for OFDM symbols
- Automatic fallback to custom implementation if Sionna API is unavailable
- Profile-specific channel characteristics
Channel Application Order
- Extract OFDM symbols from raw IQ samples
- Apply TDL/CDL channel in the frequency domain (if selected)
- Convert processed symbols back to time domain
- Apply AWGN noise (except in NONE mode)
|