Graphical understanding of Eigen Vector and Determinents
My own image for a matrix is a kind of machine that is doing things as follows. As you see in the illustration, Matrix is taking in a shape (geometrical shape/object) and transform (change shape) them in mainly three different way as follows.
i) Scale (magnify or shrink)
ii) Rotate
iii) Skew
In reality, a matrix can do more than one type of transformation like "Scale and Skew", "Scale and Rotate and Skew" etc.
![]()
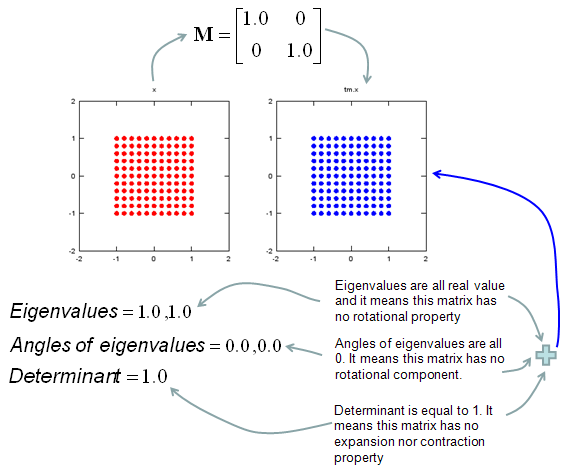
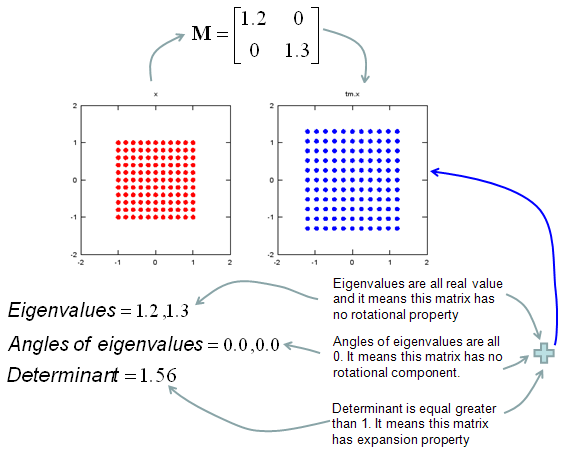
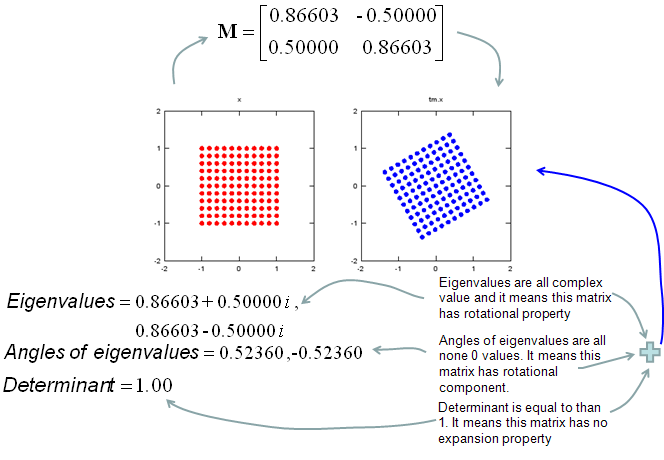
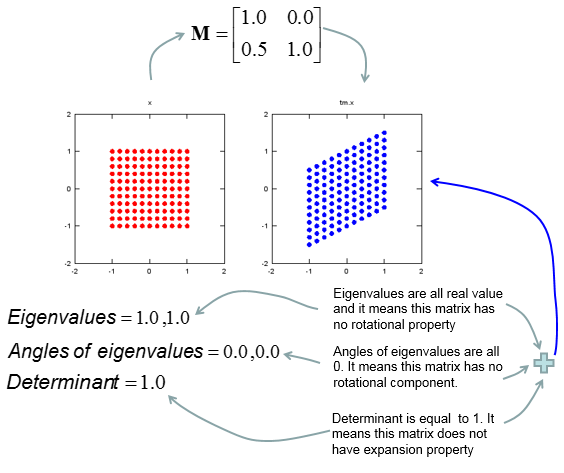
In this sections, I will show you how a matrix transforms a given image (a set of dots). For each example, I transformed 100 dots.. it means that I had to calulate "A x v" type of vector multiplication 100 times. It would have been almost undoable if I had to do it with pen and paper unless I had an extraordinary patience. (Definately I am not such a patient person -:)). Fortunately, I have a software with which I can do this kind of things relatively easy. Following is the source script that I created for these examples. You can apply whatever 2 x 2 matrix just by changing "tm = [1.0 0.0;0.5 1.0]" part.
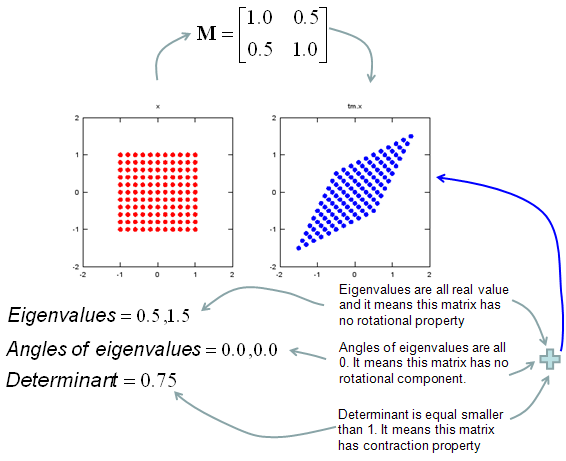
There are other very important points in these examples. For each example, I (matlab source script) calculated the following values and I put down a short comments on what kind of information you can get from these values.
i) Eigenvalue
ii) Angle of each Eigenvalue
iii) Determinant
When you were learning Eigenvalue, Determinant.. the first question you might have would be "What are these for ?" "Why do we have to calculate these values ?". This is one of the examples in which you can use eigenvalues and determinant in very useful way.
If there is no computer and I am asked to get overall image of the transformation of 100 points as in this example, I would definitely calculate eigenvalue and determinant and make a reasonable guess of the final result, rather than trying to 100 times of "A x v" calculation.
This kind of interpretation of Eigenvalue and Determinant is not only for geometrical transformation, but also can be useful almost any system represented as a Matrix system (e.g, Control System, Stochastics, Structure Analysis etc). So I strongly recommend you to go through in very detail and try a lot of example matrix with the Matlab/Octave script and get some intuitive understandings of your own.
NOTE : I also put some of other examples showing it in more intuitive ways at www.slide4math.com. Check [Matrix Real] section.
< Octave Code >
ptList_x=[];
ptList_y=[];
for y=-1.0:0.2:1.0
for x=-1.0:0.2:1.0
ptList_x=[ptList_x x];
ptList_y=[ptList_y y];
end
end
ptList_v = [ptList_x' ptList_y'];
ptList_v = ptList_v';
tm = [1.0 0.0;0.5 1.0]
tm_eigenvalue = eig(tm)
Angle_of_eigenvalues = arg(tm_eigenvalue)
tm_determinant = det(tm)
ptList_v_tm = tm * ptList_v;
ptList_v_tm_x = ptList_v_tm(1,:);
ptList_v_tm_x = ptList_v_tm_x';
ptList_v_tm_y = ptList_v_tm(2,:);
ptList_v_tm_y = ptList_v_tm_y';
subplot(1,2,1);
plot(ptList_x,ptList_y,'ro','MarkerFaceColor',[1 0 0]);axis([-2 2 -2 2]);title('x');daspect([1 1]);
subplot(1,2,2);
plot(ptList_v_tm_x,ptList_v_tm_y,'bo','MarkerFaceColor',[0 0 1]);axis([-2 2 -2 2]);title('tm.x');daspect([1 1]);
< Matlab Code >
ptList_x=[];
ptList_y=[];
for y=-1.0:0.2:1.0
for x=-1.0:0.2:1.0
ptList_x=[ptList_x x];
ptList_y=[ptList_y y];
end
end
ptList_v = [ptList_x' ptList_y'];
ptList_v = ptList_v';
tm = [1.0 0.5;0.0 1.0]
tm_eigenvalue = eig(tm)
Angle_of_eigenvalues = angle(tm_eigenvalue)
tm_determinant = det(tm)
ptList_v_tm = tm * ptList_v;
ptList_v_tm_x = ptList_v_tm(1,:);
ptList_v_tm_x = ptList_v_tm_x';
ptList_v_tm_y = ptList_v_tm(2,:);
ptList_v_tm_y = ptList_v_tm_y';
subplot(1,2,1);
plot(ptList_x,ptList_y,'ro','MarkerFaceColor',[1 0 0]);axis([-2 2 -2 2]);
title('x');axis square;
subplot(1,2,2);
plot(ptList_v_tm_x,ptList_v_tm_y,'bo','MarkerFaceColor',[0 0 1]);axis([-2 2 -2 2]);
title('tm.x');axis square;