Panda - Statistics
In this page, I will give you some of the basic operations for Panda. I will not go very deep into Panda functions in this page. This page is just for you to try some basic things without getting scared of too complicated operation right after you installed panda package.
The data for this tutorial is from https://support.spatialkey.com/spatialkey-sample-csv-data/ (If this link does not work, try this).
Download the file, unzip it and put it into the folder where Python is installed. Of course, you can put the file into other places. However, if you want to run the command in this tutorial as it is without modifying the data path, put the csv file in your Python installation folder.
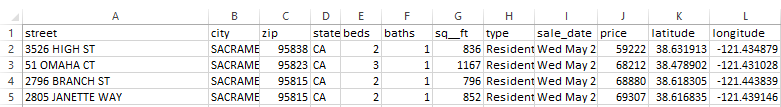
The data structure of the csv file is as shown below.
Following is the list of all the commands used in this page. These procedure is based on the tutorial (very useful) A Complete Tutorial to Learn Data Science with Python from Scratch (I would recommend you to read this document. He posted many other useful tutorials as well). I just used different data set and with some modification for my own experiment.
|
panda_stat01.py |
|
import sys import pandas as pd import numpy as np import matplotlib import matplotlib.pyplot as plt import random as rd
print('Python: {}'.format(sys.version)) print('pandas: {}'.format(pd.__version__)) print('numpy: {}'.format(np.__version__)) print('matplotlib {}'.format(matplotlib.__version__))
df = pd.read_csv('Sacramentorealestatetransactions.csv')
print(df.head(10))
print(df.describe())
df_NumData = df[['beds','baths','sq__ft','price']] print(df_NumData.describe())
df['price'].hist(bins=100) plt.show()
df.boxplot(column='price') plt.show()
df.boxplot(column='price', by = 'beds') plt.show()
df[['price','beds']].groupby('beds').boxplot() plt.show()
bedcount = df['beds'].value_counts() print(bedcount)
bedcount = df['beds'].value_counts(ascending=True) print(bedcount)
print(bedcount.sort_index(axis=0,ascending=True))
print(bedcount.sort_index(axis=0,ascending=False))
print(bedcount.sort_values(axis=0))
avgPricePivot = df.pivot_table(values='price',index=['beds'],aggfunc=lambda x: x.mean()) print(avgPricePivot)
avgPricePivot = df.pivot_table(values='price',index=['beds'],aggfunc=lambda x: [x.mean(),x.min(), x.max()]) print(avgPricePivot)
pd.plotting.scatter_matrix(df_NumData) plt.show() |
I will break down the file shown above into each step as listed below and put descriptions on it.
- import libraries
- Checking the version of Packages
- Reading data set from a csv file
- Preview of Data Structure
- Getting the Fundamental Statistics
- Plotting a Histogram
- Graphing a Boxplot
- Getting the Data Count
- Sorting the data
- Generating a Pivot Table
- Example 1 > Number of bed vs average price
- Example 2 > Number of Bed vs [mean, min, max price]
- Example 3 > City vs Available Bed Count
- Example 4 > City vs Average Prices for different number of beds (Unit Size)
- Graphing the ScatterMatrix
Followings are all the packages (libaries) that I need in this tutorial.
import sys
import pandas as pd
import numpy as np
import matplotlib
import matplotlib.pyplot as plt
import random as rd
Checking the version of Packages
This is not a mandatory step, but just to show you the version of each packages that I am using I put these lines. Some of the command (function) in this tutorial may not work properly or work but with some warning depending on the version that you are using.
print('Python: {}'.format(sys.version))
print('pandas: {}'.format(pd.__version__))
print('numpy: {}'.format(np.__version__))
print('matplotlib {}'.format(matplotlib.__version__))
Following is the result of the execution on my system at the time of writing this tutorial.
Python: 3.6.2 (v3.6.2:5fd33b5, Jul 8 2017, 04:14:34) [MSC v.1900 32 bit (Intel)]
pandas: 0.20.3
numpy: 1.13.3
matplotlib 2.1.0
Reading data set from a csv file
I read a data set from a csv file and store it to the variable df. In this example, I put the csv file in the same foder as the python script file that I wrote. That's why I don't put the file path and put the filename only.
df = pd.read_csv('Sacramentorealestatetransactions.csv')
Don't do print(df) unless you really need to do it. It will print out too much data. Instead, you can print out just a few lines from the beginning of the file and see how the overall data structure is as shown below.
print(df.head(5))
Following is the result of this command.
street city zip state beds baths sq__ft \
0 3526 HIGH ST SACRAMENTO 95838 CA 2 1 836
1 51 OMAHA CT SACRAMENTO 95823 CA 3 1 1167
2 2796 BRANCH ST SACRAMENTO 95815 CA 2 1 796
3 2805 JANETTE WAY SACRAMENTO 95815 CA 2 1 852
4 6001 MCMAHON DR SACRAMENTO 95824 CA 2 1 797
type sale_date price latitude longitude
0 Residential Wed May 21 00:00:00 EDT 2008 59222 38.631913 -121.434879
1 Residential Wed May 21 00:00:00 EDT 2008 68212 38.478902 -121.431028
2 Residential Wed May 21 00:00:00 EDT 2008 68880 38.618305 -121.443839
3 Residential Wed May 21 00:00:00 EDT 2008 69307 38.616835 -121.439146
4 Residential Wed May 21 00:00:00 EDT 2008 81900 38.519470 -121.435768
Getting the Fundamental Statistics
With applying the single function as follows, you can get the basic statistics on every numerical data.
print(df.describe())
Following is the result of the command. This commands automatically check each column on whether it is numerical data or not and calculate the statistics.
zip beds baths sq__ft price \
count 985.000000 985.000000 985.000000 985.000000 985.000000
mean 95750.697462 2.911675 1.776650 1314.916751 234144.263959
std 85.176072 1.307932 0.895371 853.048243 138365.839085
min 95603.000000 0.000000 0.000000 0.000000 1551.000000
25% 95660.000000 2.000000 1.000000 952.000000 145000.000000
50% 95762.000000 3.000000 2.000000 1304.000000 213750.000000
75% 95828.000000 4.000000 2.000000 1718.000000 300000.000000
max 95864.000000 8.000000 5.000000 5822.000000 884790.000000
latitude longitude
count 985.000000 985.000000
mean 38.607732 -121.355982
std 0.145433 0.138278
min 38.241514 -121.551704
25% 38.482717 -121.446127
50% 38.626582 -121.376220
75% 38.695589 -121.295778
max 39.020808 -120.597599
As you see above, this function extract the statistical data from every numerical data regardless of whether it is really meaningful or not. For example, you know that the mean, std, max of the zip code is meaningless but descrbe() function calculate those statistics since the zip code is typed in as a numeric form. If you want to get more meaningful information, extract the numerical data that are meaningful to you and then apply describe() function as below.
df_NumData = df[['beds','baths','sq__ft','price']]
print(df_NumData.describe())
Following is the result of this command.
beds baths sq__ft price
count 985.000000 985.000000 985.000000 985.000000
mean 2.911675 1.776650 1314.916751 234144.263959
std 1.307932 0.895371 853.048243 138365.839085
min 0.000000 0.000000 0.000000 1551.000000
25% 2.000000 1.000000 952.000000 145000.000000
50% 3.000000 2.000000 1304.000000 213750.000000
75% 4.000000 2.000000 1718.000000 300000.000000
max 8.000000 5.000000 5822.000000 884790.000000
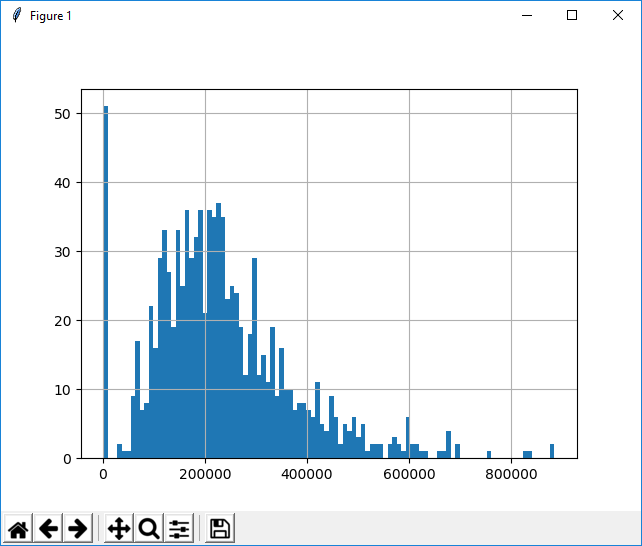
You can plot a Histogram for a data series as shown below.
df['price'].hist(bins=100)
plt.show()
Following is the result of this command.
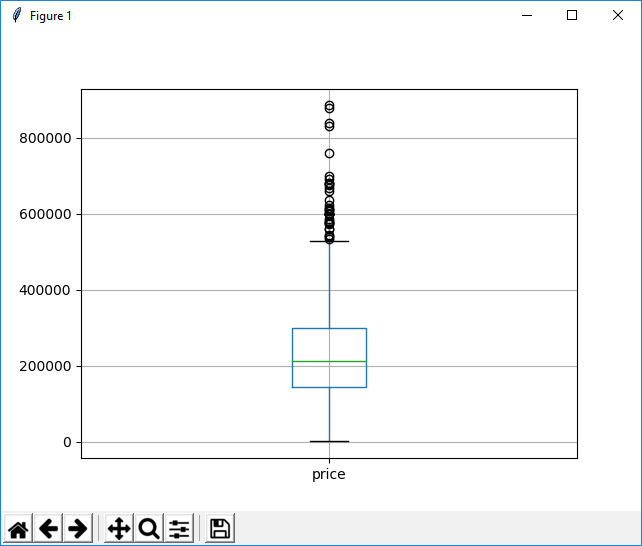
You can easily draw a box plot for a specific column or a dataset using boxplot() function as shown below. (Regarding the interpretation of the box plot, refer to the tutorial RANGE, INTERQUARTILE RANGE AND BOX PLOT . This is not my note, but much better written than I could).
df.boxplot(column='price')
plt.show()
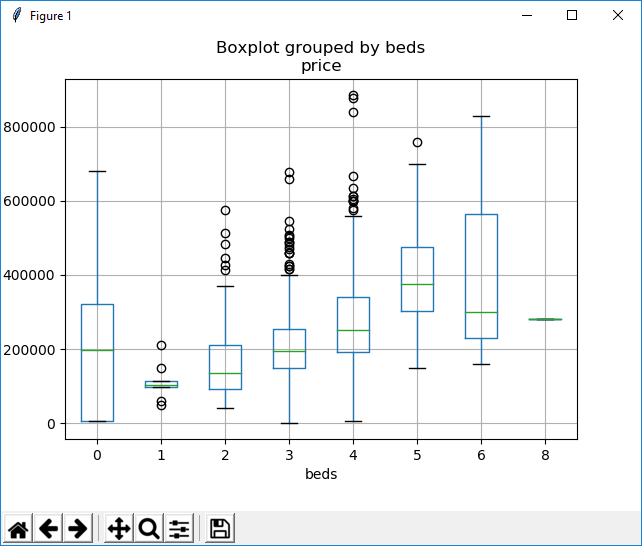
df.boxplot(column='price', by = 'beds')
plt.show()
NOTE : I got following warning on my system (Python 3.62 on Windows 10). So this command may not work any more if you are using later than Python 3.62.
Warning (from warnings module):
File "C:\Users\ca090406\AppData\Local\Programs\Python\Python36-32\lib\site-packages\numpy\core\fromnumeric.py", line 57
return getattr(obj, method)(*args, **kwds)
FutureWarning: reshape is deprecated and will raise in a subsequent release. Please use .values.reshape(...) instead
You can extract a certain colum and count the number of data for each different items in the columns as follows.
bedcount = df['beds'].value_counts()
print(bedcount)
Following is the result of this commands (The number on the left represents the number of beds and the number on the right represents the total number of occurrence of each number of beds in the data).
3 413
4 258
2 133
0 108
5 59
1 10
6 3
8 1
Name: beds, dtype: int64
You can change the order of the data by specifying 'ascending' parameter as shown below.
bedcount = df['beds'].value_counts(ascending=True)
print(bedcount)
Following is the result of this commands
8 1
6 3
1 10
5 59
0 108
2 133
4 258
3 413
Name: beds, dtype: int64
You can sort a data set using the function sort_index() or sort_value() as shown below.
bedcount = df['beds'].value_counts()
print(bedcount.sort_index(axis=0,ascending=True))
0 108
1 10
2 133
3 413
4 258
5 59
6 3
8 1
Name: beds, dtype: int64
print(bedcount.sort_index(axis=0,ascending=False))
8 1
6 3
5 59
4 258
3 413
2 133
1 10
0 108
Name: beds, dtype: int64
print(bedcount.sort_values(axis=0))
8 1
6 3
1 10
5 59
0 108
2 133
4 258
3 413
Name: beds, dtype: int64
Probably one of the most powerful function in pandas would be pivot_table() function. If you have no experience of generating Pivot table or don't know what is a Pivot Table, I would suggest you try to generate some of pivot tables using Spreadsheet program (like Microsoft Excel). I would explain the usage of pivot_table() function in comparison to Microsoft Excel Pivot Table as shown below.
Example 1 > Number of bed vs average price
avgPricePivot = df.pivot_table(values='price',index=['beds'],aggfunc=lambda x: x.mean())
print(avgPricePivot)
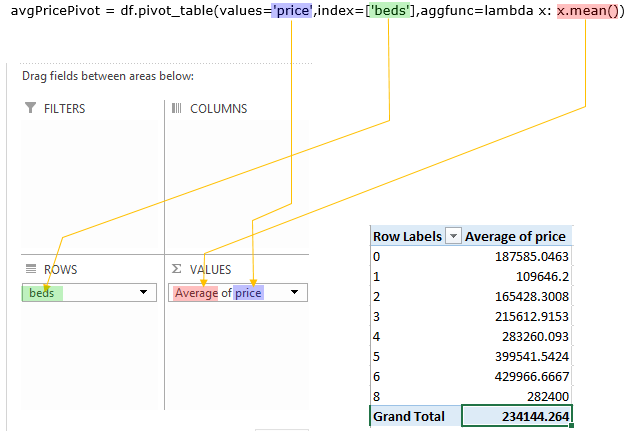
Following is the result of the execution shown above.
price
beds
0 187585.046296
1 109646.200000
2 165428.300752
3 215612.915254
4 283260.093023
5 399541.542373
6 429966.666667
8 282400.000000
Example 2 > Number of Bed vs [mean, min, max price]
You can specify the multiple columns in the pivot table by modifying the lamda function as shown below.
avgPricePivot = df.pivot_table(values='price',index=['beds'],
aggfunc=lambda x: [x.mean(),x.min(), x.max()])
print(avgPricePivot)
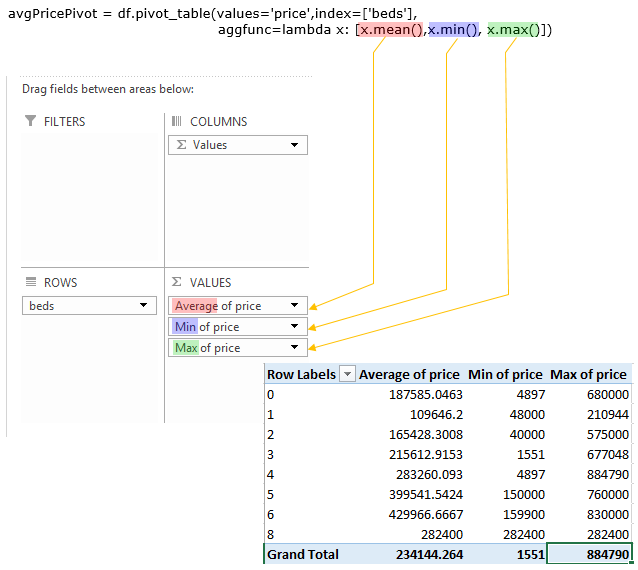
Following is the result of the execution shown above.
price
beds
0 [187585.046296, 4897, 680000]
1 [109646.2, 48000, 210944]
2 [165428.300752, 40000, 575000]
3 [215612.915254, 1551, 677048]
4 [283260.093023, 4897, 884790]
5 [399541.542373, 150000, 760000]
6 [429966.666667, 159900, 830000]
8 [282400.0, 282400, 282400]
Example 3 > City vs Available Bed Count
This is not directly related to pivot table function, but I ran this first so that the every column gets printed out for display.
>>> pd.set_option('display.max_columns', None)
Now create the pivot table showing City Name in rows, the number of beds in column and the number of available units in each cell.
>>> BedCountInCity = df.pivot_table(values='price',index=['city'],columns=['beds'],aggfunc=lambda x: x.count())
Just in canse the result values has NaN, replace the NaN with 0 and convert the values in integer.
>>> BedCountInCity = BedCountInCity.fillna(0).astype(int)
Print the first 5 rows of the data.
>>> BedCountInCity.head()
beds 0 1 2 3 4 5 6 8
city
ANTELOPE 0 0 3 18 9 3 0 0
AUBURN 0 0 2 1 2 0 0 0
CAMERON PARK 1 0 3 4 1 0 0 0
CARMICHAEL 0 0 4 11 5 0 0 0
CITRUS HEIGHTS 0 0 4 20 10 1 0 0
Example 4 > City vs Average Prices for different number of beds (Unit Size)
This is not directly related to pivot table function, but I ran this first so that the every column gets printed out for display.
>>> pd.set_option('display.max_columns', None)
Now create the pivot table showing City Name in rows, the number of beds in column and the number of available units in each cell.
>>> AveragePricePerUnit = df.pivot_table(values='price',index=['city'],columns=['beds'],aggfunc=lambda x: x.mean())
Just in canse the result values has NaN, replace the NaN with 0 and convert the values in integer.
>>> AveragePricePerUnit = AveragePricePerUnit.fillna(0).astype(int)
Print the first 5 rows of the data.
>>> AveragePricePerUnit.head()
beds 0 1 2 3 4 5 6 8
city
ANTELOPE 0 0 152083 207754 279617 320000 0 0
AUBURN 0 0 272500 504000 490227 0 0 0
CAMERON PARK 119000 0 206666 312375 423000 0 0 0
CARMICHAEL 0 0 284209 257499 388873 0 0 0
CITRUS HEIGHTS 0 0 112562 192702 198867 256054 0 0
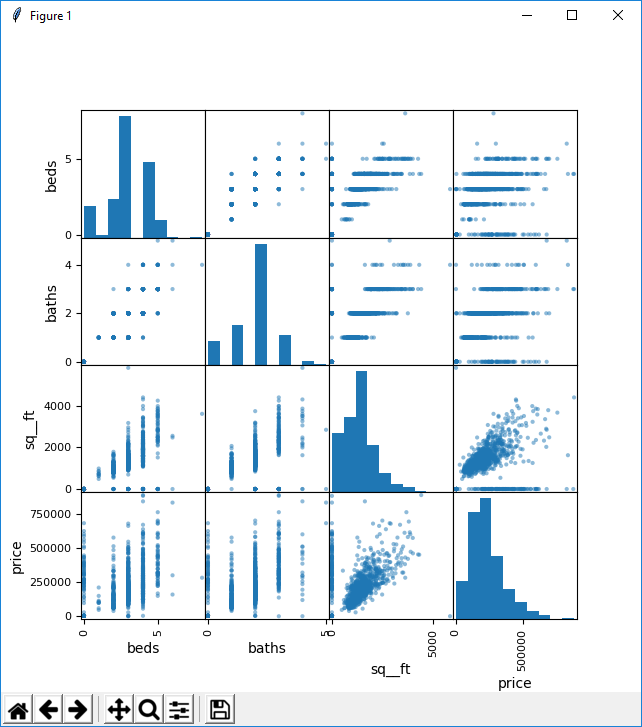
When you have a dataset with multiple numerical columns, you can visualize the correlations among those columns by drawing scatterplots between each of the items. you can do this very easily as shown below.
df_NumData = df[['beds','baths','sq__ft','price']]
pd.plotting.scatter_matrix(df_NumData)
plt.show()
NOTE : If the command shown above does not work on your system because you are using older version of the package, you may try as follows.
df_NumData = df[['beds','baths','sq__ft','price']]
pd.tools.plotting.scatter_matrix(df_NumData)
plt.show()
Regarding the interpretation of the scatter plot, I would suggest you to go through CONTINGENCY TABLE, SCATTERPLOT & PEARSON’S R
Reference :
[1] A Complete Tutorial to Learn Data Science with Python from Scratch
[2] Python for Data Analysis Part 20: Plotting with Pandas
[3] Your First Machine Learning Project in Python Step-By-Step
[4] RANGE, INTERQUARTILE RANGE AND BOX PLOT
[5] CONTINGENCY TABLE, SCATTERPLOT & PEARSON’S R