|
6G Channel Model
I think the way we investigate on channel characterization would be similar regardless of the frequency range. So if you have any knowledge on channel characterization for any of previous technology (e.g, 5G channel characterization), it would be much easier to follow up on Terahertz Channel Characterization. If you are interested in my note about 5G channel characterized done in before and
early 5G standization, check this page.
As of initial writing of this note (May 2021), I haven't got much of the information about 300Ghz ~ 1 Thz yet. Most of the information (e.g, tech articles or papers) on this topic is largely around D-Band (110~170 Ghz) or W-Band(75~110Ghz).
: In early 2021, some papers and white papers are published on channel sounder in 300 Ghz region, but with distance between Transmitter and Reciever is just around a few meters. (Check here )
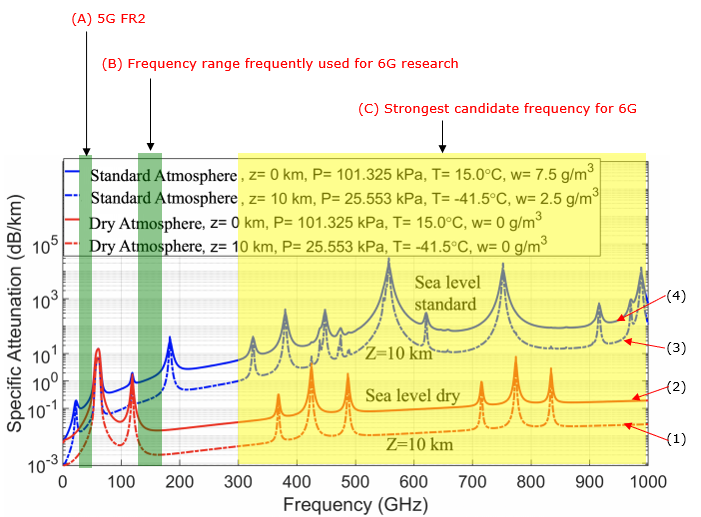
This is about Atmospheric Attenuation. As commonly understood, we see the general tendency of increasing attenuation as frequency goes higher. As a result, we will see higher attenuation in Tera Hertz candate (C) frequency comparing to 5G or D band (B). In the 6G Candidate ranges, we see much less attenuation in dry environment ((1) & (2)) comparing to standard environment ((3) &
(4)) implying that interacting with water molecule would play an important role. The attenuation at higher altitude ((1) & (3)) is lower than the case at sea level ((2) & (4)).
Source : NYT Wireless - Publication
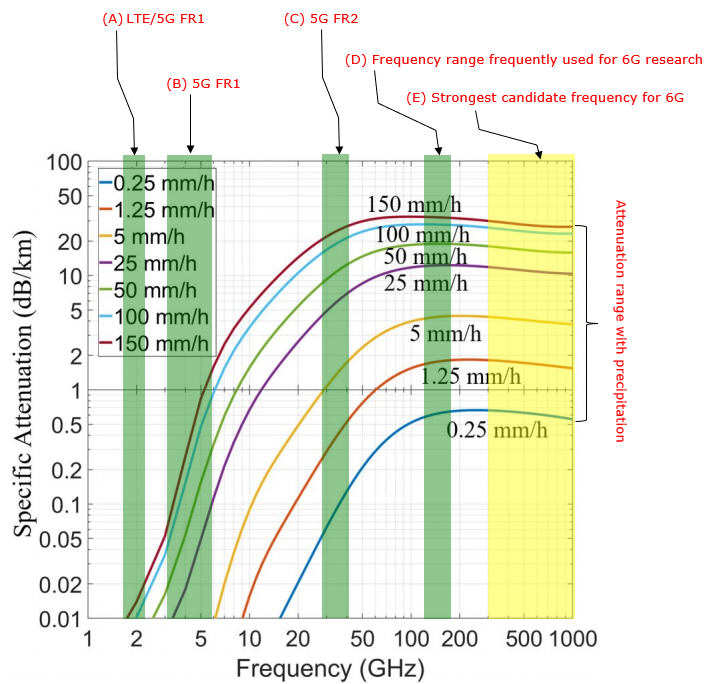
In terms of Attenuation by Rain, it is obvious that the precipitation affects a lot on attenuation, but regarding the frequency effects there is not much differences between 5G FR2(C) and 6G Candiate Frequency(D, E).
Source : NYT Wireless - Publication
This illustrate a Path Loss Model, which is a mathematical formula used in wireless communications to predict the loss of signal strength (path loss) with distance. The following equation is for a Close-In (CI) reference distance path loss model with frequency dependence.
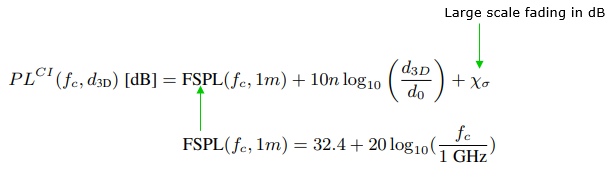
Following is the break-down of the equation.
-
PLCI(fc, d3D) [dB] represents the path loss in decibels (dB) at a certain frequency fc and a 3-dimensional distance d3D from the transmitter.
-
FSPL(fc, 1m) is the Free Space Path Loss at the frequency fc for a 1-meter distance. It's calculated using the formula FSPL(fc, 1m) = 32.4 + 20log10(fc/1 GHz), which gives the path loss in free space (without any obstacles) at 1 meter.
-
10n log10(d3D/d0 ) accounts for the path loss exponent n, which varies depending on the environment (e.g., urban, rural, indoor). The term d0 is a reference distance, typically 1 meter.
-
Xσ represents large-scale fading in dB, which accounts for the shadowing effect by obstacles causing signal attenuation. It is a random variable, usually modelled as a Gaussian (normal) distribution with zero mean and a standard deviation σ.
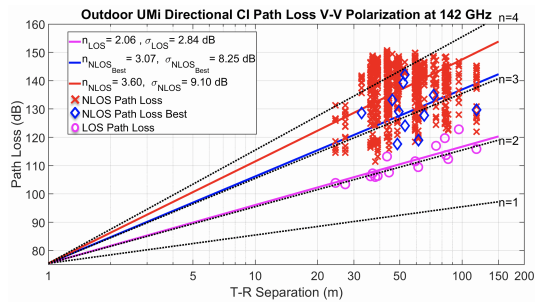
Following plot shows the actual measured path loss for an outdoor Urban Microcell (UMi) scenario at 142 GHz with vertical-to-vertical (V-V) polarization.
Source : NYT Wireless - Publication
-
LOS (Line of Sight) is where the transmitter and receiver have a clear path between them. The path loss is lower in LOS conditions.
-
NLOS (Non-Line of Sight) is where there are obstructions between the transmitter and receiver. The path loss is higher in NLOS conditions.
-
The different color and marks represent measured path loss values at different distances (T-R Separation).
-
The slopes of the lines (n) represent the path loss exponent and show how fast the path loss increases with distance. The higher the value of n, the steeper the slope and the faster the signal strength decays with distance.
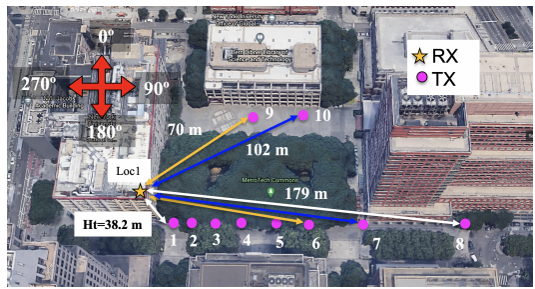
Following data represents signal attenuation due to foliage (trees and other vegetation) at a frequency of 142 GHz, which is a millimeter-wave frequency considered for future wireless communications such as 6G.
Following map shows an aerial view of a location with designated transmission (TX) and reception (RX) points for wireless signals. There are multiple lines emanating from the TX location (marked as "Loc1") to various points, represented by the numbered pink dots. These lines likely represent different paths the signal will take, with some paths passing through foliage, as indicated by the line marked with tree symbols, and others having clear line-of-sight (LOS).
The map and accompanying table illustrates and quantify how much signal strength is lost when wireless signals at 142 GHz pass through foliage compared to clear LOS situations.
Source : NYT Wireless - Publication
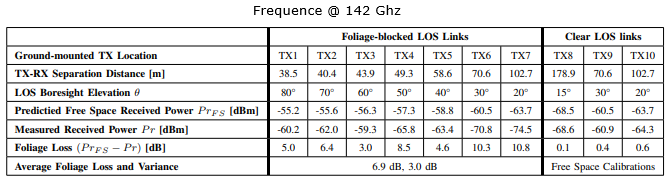
Following table represents data from various transmission points (TX1, TX2, etc.).
Source : NYT Wireless - Publication
The table carries various comparative values for various condition listed below.
-
"TX-RX separation distance in meters" indicates the distance between the transmitter and receiver.
-
"LOS Boresight Elevation" could refer to the angle of elevation from the transmitter to the receiver in a direct line of sight.
-
"Predicted Free Space Received Power PrFS [dBm]" is the expected power level at the receiver if there were no obstructions, calculated based on the free space path loss model.
-
"Measured Received Power Pr [dBm]" is the actual power level measured at the receiver.
-
"Foliage Loss" is the difference between the predicted free space received power and the actual measured power, indicating how much signal power is lost due to the foliage.
-
"Average Foliage Loss and Variance" gives a summary of the average loss and variability in signal strength due to foliage for the measured links.
Channel sounding is a technique used to characterize the channel behavior by sending known signals through it and analyzing how they are altered.
Example : THz Channel Sounding: Design and Validation of a High Performance Channel Sounder at 300 GHz
This example presents information on a terahertz (THz) channel sounding system, which is a setup designed to measure and analyze the properties of a wireless communication channel at terahertz frequencies, specifically at 300 GHz in this case.
Following is the diagram for the test setup. This setup is used to transmit a signal from the signal generator through the THz transceiver, which is then received by another transceiver and analyzed by the spectrum analyzer. The system aims to measure how the signal is affected by the channel it passes through, which includes the effects of absorption, reflection, scattering, and diffraction, all of which can be significant at THz frequencies.
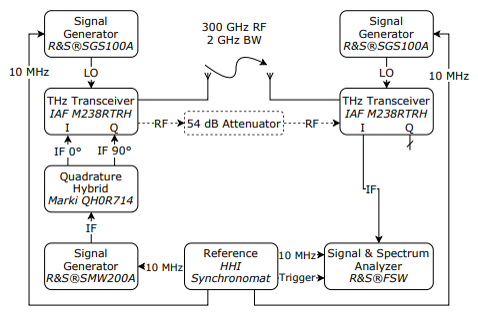
Follwings are highlights of this block diagram.
- Two Signal Generators (R&S SGS100A) generate the local oscillator (LO) signal to mix with the RF signal, providing the required carrier frequency.
- The THz Transceiver (IAF M2387RTH) is the main device that transmits and receives signals in the THz range.
- Quadrature Hybrid (Marki QH0714) is used to split or combine signals into in-phase (I) and quadrature (Q) components, which are 90 degrees out of phase.
- Attenuators are used to reduce the power level of the RF signal to prevent damage to the equipment or to fit the dynamic range of the system.
- A Signal & Spectrum Analyzer (R&S FSW) is used to analyze the received signals, measuring their frequency content and other properties.
- A Reference Signal Generator (R&S SMW200A) provides a timing reference for synchronization.
- HHI Synchronomator is likely a synchronization module used to ensure that all components of the system are operating coherently.
This specific test describe a laboratory environment setup for a channel sounding test and the resulting measurement of the channel's impulse response. This test is a particular instance of channel sounding where a short pulse or a wideband signal is sent from the Tx, and the Rx captures the arriving signals over time, allowing for the characterization of the channel.
In test setup, there are two antennas set up 1 meter apart on a table, with one acting as the transmitter (Tx) and the other as the receiver (Rx). The antennas are elevated 0.4 meters above the table, and there is a wall nearby, which might reflect or scatter the transmitted signals.
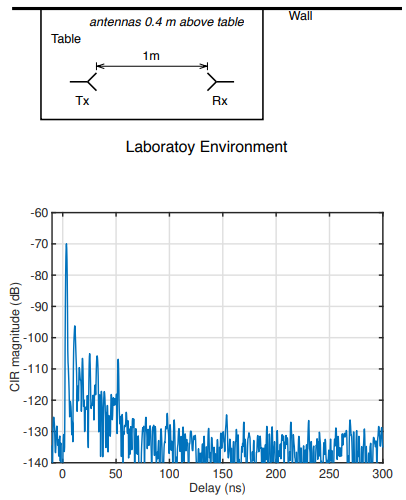
The graph shown above represent the channel impulse response, with the vertical axis representing the Channel Impulse Response (CIR) magnitude in decibels (dB) and the horizontal axis representing time in nanoseconds (ns).
- The CIR is a measure of how a signal is modified by the channel between the transmitter and receiver over time.
- The sharp spike at the beginning (near 0 ns) represents the Line of Sight (LOS) component of the signal, which is the strongest because it travels the shortest distance directly from Tx to Rx.
- The other spikes seen throughout the graph are multipath components. These are reflections from objects in the environment, like the table or walls, which arrive at the receiver at different times (hence different delays) and with different magnitudes (usually weaker than the LOS component).
- The spread of these multipath components in time (delay spread) can give an indication of the multipath richness of the environment, which affects the channel's capacity to transmit data.
Following is another laboratory setup for channel sounding, similar to the previous one you shared, with an accompanying graph that shows the measured channel impulse response (CIR).
The diagram illustrates a controlled test environment with a transmitter (Tx) and receiver (Rx) positioned 1.35 meters apart on a table. The antennas are 0.4 meters above the table surface, and there are reflectors at a distance of 0.35 meters and 1.25 meters from the Tx and Rx, respectively. These reflectors are likely metallic or other materials that bounce the signal, creating reflections that will be captured by the receiver.
The presence of reflectors in the setup is intended to study the effects of signal reflection and multipath propagation within a controlled environment. Understanding how signals interact with various objects and materials is essential for designing communication systems, especially in scenarios where direct LOS is not always possible and multipath can significantly affect signal quality.
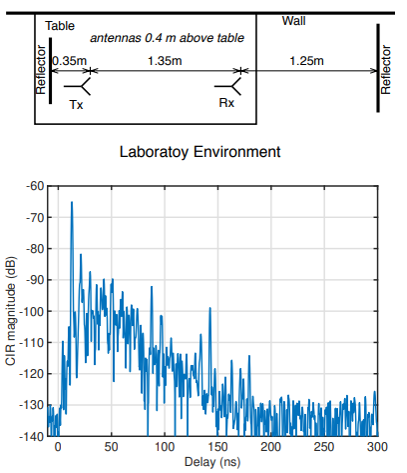
The graph shown above depects the CIR magnitude in decibels (dB) on the vertical axis versus time delay in nanoseconds (ns) on the horizontal axis.
- The graph indicates how the signal's power diminishes as the delay increases, which is typical due to the signal spreading out and losing energy over distance and interactions with the environment.
- The initial peak near 0 ns represents the direct path (LOS) signal, which is the strongest and arrives with the least delay.
- Subsequent spikes and variations in signal strength correspond to multipath components caused by reflections off the reflectors and other objects within the lab environment.
- The multipath components appear to be quite significant, as evidenced by the numerous spikes following the initial peak, suggesting that the signal experiences multiple reflections before arriving at the Rx.
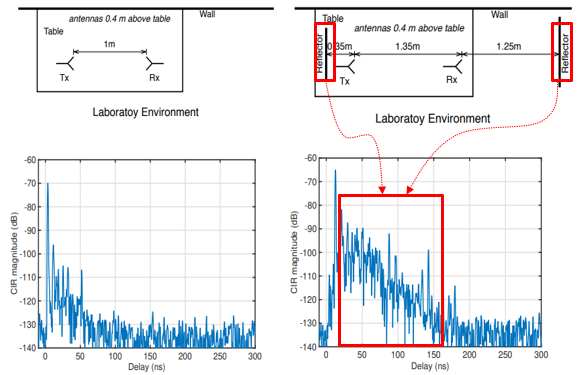
NOTE : Comparison of the two
Following is side by side comparison of the two test result we looked at. The key difference is that the presence of reflector and resulting CIR at the second test. The second setup with dedicated reflectors creates a more complex multipath environment, which is clearly illustrated by the more dense and varied multipath components in the CIR graph.
Followings are break down of the comparison :
- Reflectors
- In the first setup:
- There are no dedicated reflectors; only a wall is indicated which might act as a reflective surface.
- In the second setup:
- Two specific reflectors are placed near the Tx and Rx. Their presence is intended to create additional paths (multipath) for the signal to travel and reflect from, which would be measured in the channel sounding experiment.
- Multipath Effect
- When observing the CIR graphs for both setups, the following can be deduced:
- First CIR Graph (without dedicated reflectors): The multipath components appear as smaller spikes after the main LOS peak. The presence of the wall may contribute to these, but without dedicated reflectors, the multipath effects are less pronounced, resulting in a graph with fewer and less distinct spikes after the LOS peak.
- Second CIR Graph (with dedicated reflectors): The graph shows a higher density of multipath components, as evidenced by the many spikes of varying magnitudes. The introduction of specific reflectors at measured distances from the Tx and Rx creates a more complex environment where the signal can reflect multiple times before reaching the receiver. This complexity is reflected in the increased number and variation of multipath spikes in the CIR graph.
- Comparison Based on Reflectors and Multipath Effects
- Presence of Reflectors: The second setup's reflectors are likely metallic or highly reflective materials, which introduce additional discrete paths for the signal reflection, as opposed to the more diffuse reflection from the wall in the first setup.
- Impact on CIR: The second CIR graph shows a more complex multipath environment, as expected due to the presence of dedicated reflectors. The multipath components in this graph are more numerous and have higher amplitudes compared to the first graph.
- Multipath Delay Spread: Both setups show a spread of multipath components over time, but the second setup likely has a larger delay spread due to the additional, intentional reflections. This can be seen in the denser clustering of reflections over time in the second CIR graph.
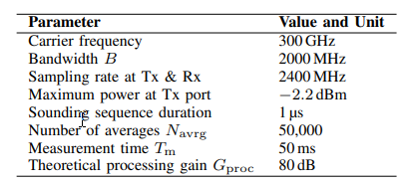
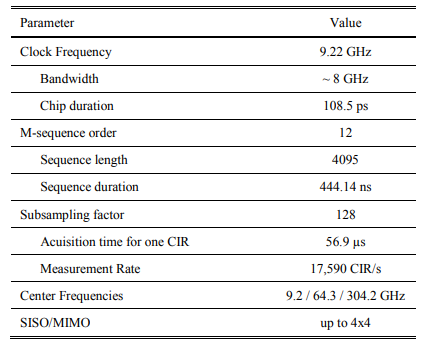
Example : Channel Sounding Techniques for Applications in THz Communications
This is another example of parameters and a setup for channel sounding, specifically tailored for terahertz (THz) communication systems. The parameters and configurations used in this test is summarized in the table below.
The test setup block diagram and actual hardware looks as below. By controlling variables like antenna orientation (using the mechanical rotation unit) and minimizing interference (using absorbers), researchers can accurately characterize how signals propagate and reflect in various scenarios
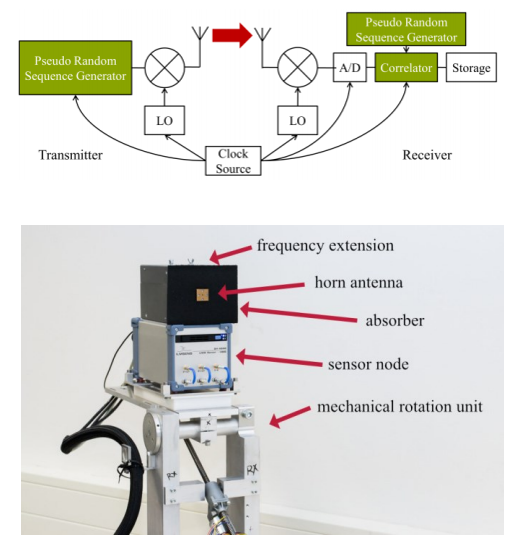
Followings are short descriptions for each of the components.
- Pseudo Random Sequence Generator: This device generates a sequence of bits that appear random but are actually deterministic, known both to the transmitter and the receiver.
- Local Oscillators (LO): These components are used to upconvert the baseband signal generated by the pseudo-random sequence generator to the carrier frequency for transmission and downconvert the received signal back to baseband for analysis.
- Clock Source: Provides the timing signals to synchronize the operation of the system.
- Transmitter: It sends out the signal generated by the pseudo-random sequence generator after it has been upconverted in frequency by the LO.
- Receiver: It receives the transmitted signal, downconverts it to baseband, and processes it.
- A/D: Stands for Analog-to-Digital Converter, which digitizes the received analog signal for further digital processing.
- Correlator: A digital component that cross-correlates the received signal with the transmitted pseudo-random sequence to determine the channel impulse response.
- Storage: Where the processed data (e.g., the channel impulse response) is stored for later analysis.
- Frequency Extension: This device converts the signal to the desired high frequency necessary for THz communication.
- Horn Antenna: A type of antenna that directs radio waves into a beam. It is used both to transmit and receive high-frequency signals in channel sounding experiments.
- Absorber: Material used to absorb electromagnetic waves and reduce reflections that could interfere with the experiment.
- Mechanical Rotation Unit: This allows for the physical movement of the equipment, which can be crucial for measuring the channel characteristics in different orientations, emulating a dynamic environment, or capturing a 360-degree profile of the channel.
Following is a graph typically used to represent the results from the setup described above. It is a plot of the channel impulse response (CIR).
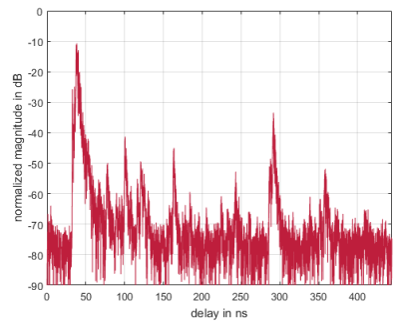
Followings are the details of the plot :
- Vertical Axis (Normalized magnitude in dB): This shows the received signal strength in decibels, normalized to some reference level. Normalization is often done to compare the strength of all received multipath components relative to the strongest one, or to a known transmitted signal level.
- Horizontal Axis (Delay in ns): This axis shows the time delay of the received signal components in nanoseconds (ns). Each point represents the time it takes for a multipath component to travel from the transmitter to the receiver.
- Spikes in the Graph: Each spike represents a multipath component of the signal. The tallest spike, typically near the beginning of the graph, corresponds to the line-of-sight (LOS) component, which is the signal that travels directly from the transmitter to the receiver without any reflections. This component generally arrives first and with the highest magnitude.
- Subsequent Smaller Spikes: These are echoes of the signal that have bounced off various objects in the environment, such as walls, floors, furniture, etc., before arriving at the receiver. The height of each spike indicates the relative strength of that particular multipath component, and the position along the horizontal axis indicates its time delay relative to the LOS component.
- Spread of Multipath Components: The spread of the spikes over the time delay axis indicates the multipath delay spread of the channel. A large delay spread means that reflections are arriving over a longer period of time, which can lead to intersymbol interference (ISI) in a communication system, where multiple copies of a signal interfere with each other.
Reference
YouTube
|
|