|
Embedded System - Arduino |
||
|
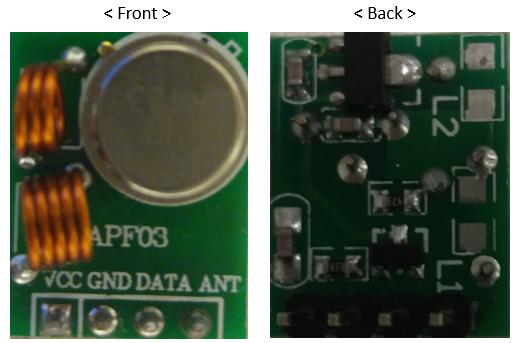
RF Transmitter (433 Mhz)
This tutorial is to show an application of transmitting a RF signal using a 433 Mhz RF transmitter module. Using this module, you can generate and transmit an ASK (Amplitude Shift Keying) modulated signal and the module looks as follows. I think this is a variation of the module that is introduced in YouTube tutorial : Cheaper Wireless for Arduino. I think the only difference is the location of Antenna Pin.
In this page, I will show you various different ways to test this module using several different setup. These are just basic function test and I would not build any functioning communication system.
Testing the Module without Using Arduino
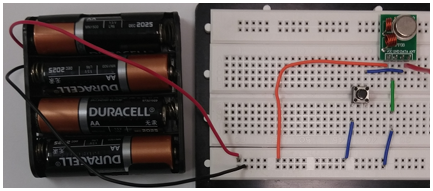
Just to check the operation of the module, I will create a simple circuit as shown below (I am not using the Arduino at this stage). In order to check whether the transmitter is really working, you would need something to detect the signal. I used my RTL module and SDRSharp as a kind of spectrum analyzer to detect the signal (If you have a spectrum analyzer, you can use the equipment or you can even use oscilloscope if you have it).
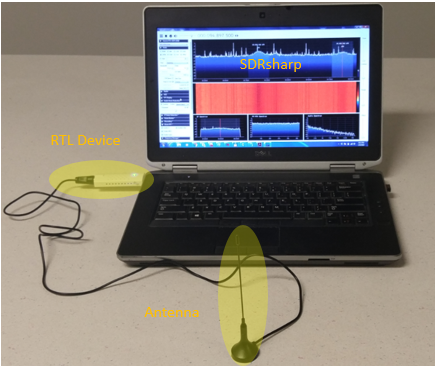
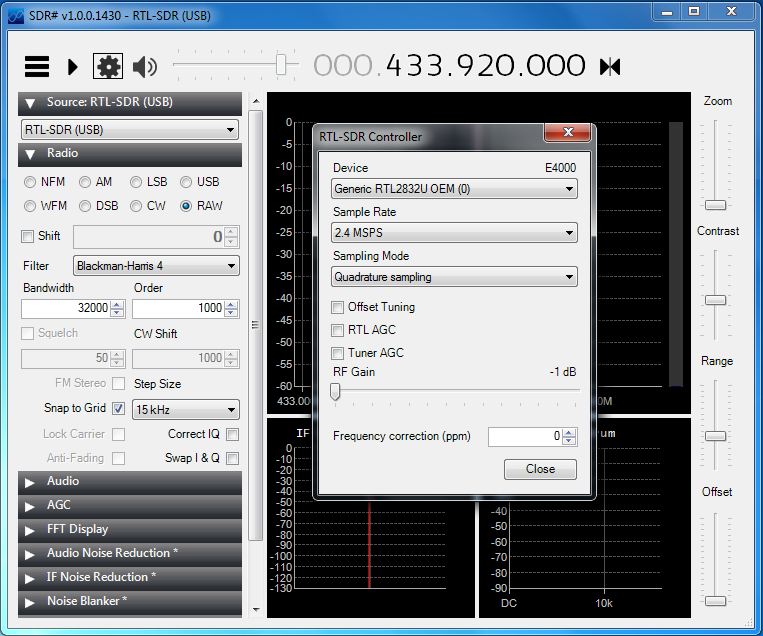
Following is the RTL SDR setup that I used as signal detector. You can get the detailed information/tutorials on this system on RTL 2832 Application page.
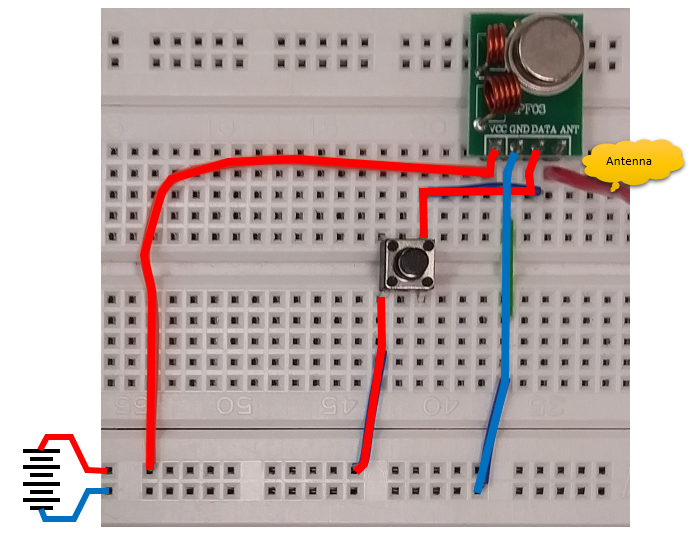
Following is the maginfied picture of the circuit that I used. I used just a short segment of wire as an antenna. (Since the carrier frequency is 433 Mhz, the length of the monopole antenna can be around 17 cm (=1/4 wavelength x (3 x 10^8)/(433 x 10^6)). Or you can use an wire of n x 17 where n = 1, 3, 5 etc). Actually, in my test setup where the transmitter and reciever is just around 1 m. I don't even need the antenna at all. Even without the antenna, sometimes the signal strength is too strong to saturate the reciever amplifier of RTL Module). Once you have this circuit done, the module transmit the 433 Mhz signal whenever you press the switch.
Testing with RTL Reciever and SDR Sharp
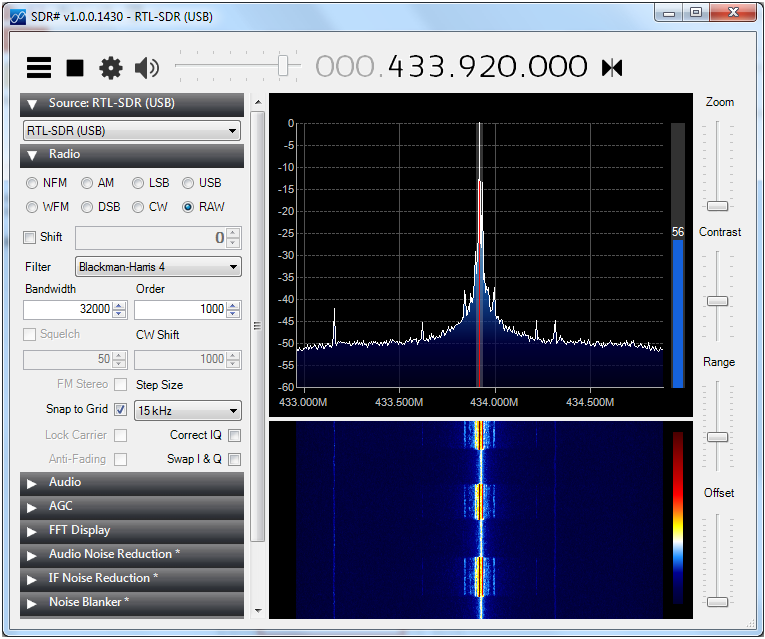
Now to detect the signal transmitted from the module, I set the SDR sharp as follows. The Tx module shown above uses 433.92 Mhz SAW Resonator on it. So I set the frequency as 433.92 but you may need to try with several other frequencies around 433 Mhz to find exact frequency for your module. If the transmitter and RTL reciever are placed too close and the signal strength is too strong, I would recommend you to turn off all the AGC and set RF Gain to be very low, otherwise you would get a saturated (clipped) signal.
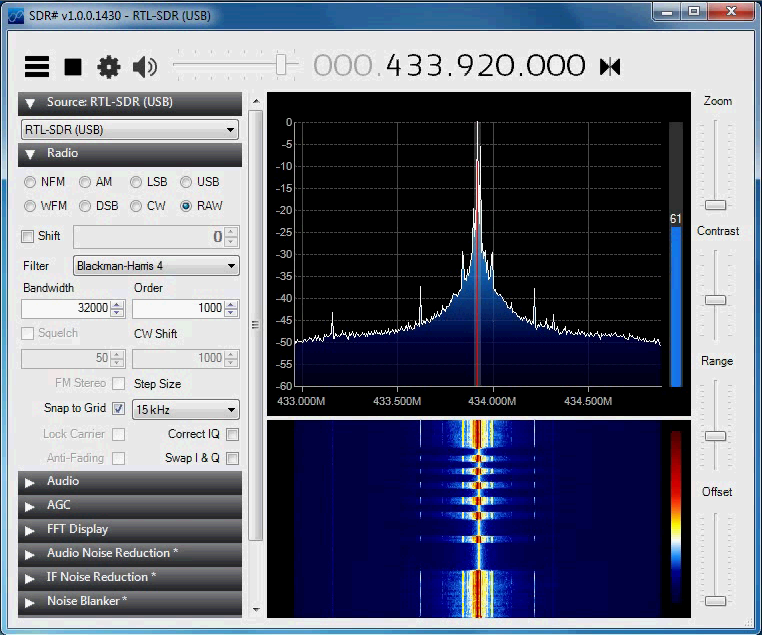
Then press [Start] button on SDR Sharp. Press the button on transmitter circuit. You will get the spectrum as shown below while the button is pressed.
Testing with RTL Reciever and Matlab - Snapshot
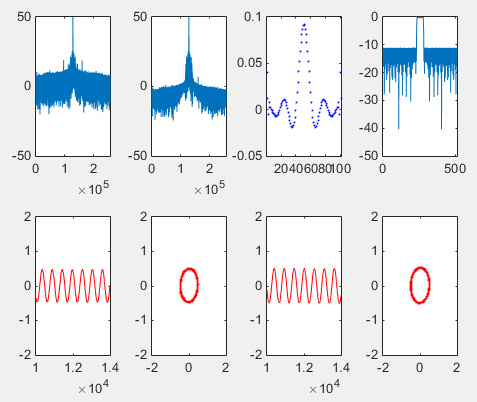
Following is about capturing the signal from the Transmitter module using RTL and Matlab. Following is the result of plotting the captured signal.
Following is the source code that produced the plot shown above.
clear all;
% Define Parameters for RTL Device.
RTL_USB_ID = '0'; RTL_USB_CarrierFrequency = 433.92e6; RTL_USB_Gain = -1; RTL_USB_SamplingFrequency = 2.4e6; RTL_USB_ppm = 0; %RTL_USB_FrameLength = 256*16*50; RTL_USB_FrameLength = 256*20*50; RTL_USB_DataType = 'single';
% Define a Handle to SDR RTL Device % A parameter you need to set carefully would be 'EnableTunerAGC'. In my example, % I set it as 'true' meaning that the Gain is set automatically by the RTL hardware. % you can set a specific Gain value if you like, but in that case the signal level % coming into RTL antenna should be good and should not fluctuating too much.
Handle_RTL_USB = comm.SDRRTLReceiver(... RTL_USB_ID,... 'CenterFrequency', RTL_USB_CarrierFrequency,... 'EnableTunerAGC', false,... 'TunerGain', RTL_USB_Gain, ... 'SampleRate', RTL_USB_SamplingFrequency, ... 'SamplesPerFrame', RTL_USB_FrameLength,... 'OutputDataType', RTL_USB_DataType,... 'FrequencyCorrection', RTL_USB_ppm);
% Following line activate hardware and capture the I/Q data and store it in the variable raw_data
raw_data = step(Handle_RTL_USB);
% Following is a digital filter to remove the noise from the captured signal. But the parameters for the filter is % not specially optimized for the RKE. I just used the same parameters that I used for FM demodulation. % You may try with different parameters optimized for RKE if you want. % It would be good for you to understand digital filter parameters. a = 1; b = firpm(100,[0,10e3,12e3,(240e3/2)]/(240e3/2), [1 1 0 0], [1 1], 40); y = filter(b,a,raw_data);
% this is to specify the range of the data to cut out from the captured data (raw_data). Since I captured % pretty many samples, it would take too long time to plot if you try to plot it all.
block = 10000:14000;
% Followings are for producing those plots shown above.
subplot(2,4,1); plot(10*log10(abs(fftshift(fft(raw_data)))));xlim([0 length(raw_data)]); ylim([-50 50]);
subplot(2,4,2); plot(10*log10(abs(fftshift(fft(y)))));xlim([0 length(y)]); ylim([-50 50]);
subplot(2,4,3); plot(b,'bo','MarkerFaceColor',[0 0 1],'MarkerSize',1); xlim([1 length(b)]);
subplot(2,4,4); plot(10*log10(abs(fftshift(fft(b,512))))); xlim([0 512]); ylim([-50 0]);
subplot(2,4,5); plot(block,real(raw_data(block)),'r-'); xlim([block(1) block(end)]); ylim([-2 2]);
subplot(2,4,6); plot(real(raw_data(block)),imag(raw_data(block)),'ro','MarkerFaceColor',[0 0 1],'MarkerSize',1); axis([-2 2 -2 2]);
subplot(2,4,7); plot(block,real(y(block)),'r-'); xlim([block(1) block(end)]); ylim([-2 2]);
subplot(2,4,8); plot(real(y(block)),imag(y(block)),'ro','MarkerFaceColor',[0 0 1],'MarkerSize',1); axis([-2 2 -2 2]);
% Save the 'raw_data' into a csv file. This saved file will be used for analysis in next step. dlmwrite('Tx_433_92_Gain_m1.dat',raw_data,'newline','pc');
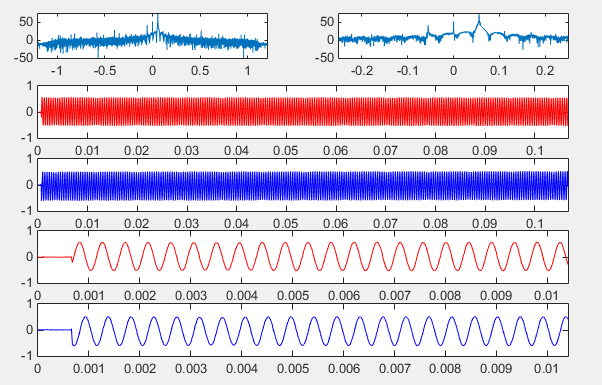
Next step was to analyze the data captured above in more detail. Followings are the result of the analysis (very simple analysis) for the data saved in the csv file. Following is the result of plotting the I/Q data captured by the RTL reciever.
Following is Matlab code that produces the result shown above. clear all;
% following is to read the data from the data file. You see I transposed the read data, but no special % methematical reason for the transpose. It is just to match the dimension (vector dimension) with % other variables like 't' and 'f' that will be created later.
raw_data = csvread('Tx_433_92_Gain_m1.dat'); raw_data = raw_data';
% Following is to decimate (undersample) the capture data. Since the number of samples that I captured % is pretty big and the signal bandwidth is much narrower than the sampling bandwidth. I decided to % undersample the data to increase the speed of next level processing (like plotting)
decimation_factor = 25; decimated_data = decimate(double(raw_data),decimation_factor,8);
% Following is to create tick marks for time domain and frequency domain.
t = linspace(0,length(decimated_data)-1,length(decimated_data)) ./ ... (2.4e6/decimation_factor); f = linspace(0,2.4e6,length(t))/1e6; f = f - 0.5*max(f);
% Following is the cut out a specific portions of data from decimated_data to magnify the plot % in horizontal axis
chunk_range = 1:1000;
% Followings are plotting routine that generates the plots shown above.
subplot(5,2,1); freq_dB = 20*log10(abs(fftshift(fft(decimated_data)))); plot(f,freq_dB); xlim([f(1) f(end)]); ylim([-50 max(freq_dB)]);
subplot(5,2,2); freq_dB = 20*log10(abs(fftshift(fft(decimated_data)))); plot(f,freq_dB); xlim([-0.25 0.25]); ylim([-50 max(freq_dB)])
subplot(5,2,[3 4]); plot(t,real(decimated_data),'r-'); xlim([t(1) t(end)]);
subplot(5,2,[5 6]); plot(t,imag(decimated_data),'b-'); xlim([t(1) t(end)]);
subplot(5,2,[7 8]); plot(t(chunk_range),real(decimated_data(chunk_range)),'r-'); xlim([t(chunk_range(1)) t(chunk_range(end))]);
subplot(5,2,[9 10]); plot(t(chunk_range),imag(decimated_data(chunk_range)),'b-'); xlim([t(chunk_range(1)) t(chunk_range(end))]);
Testing with Arduino and RTL Reciever + SDRSharp
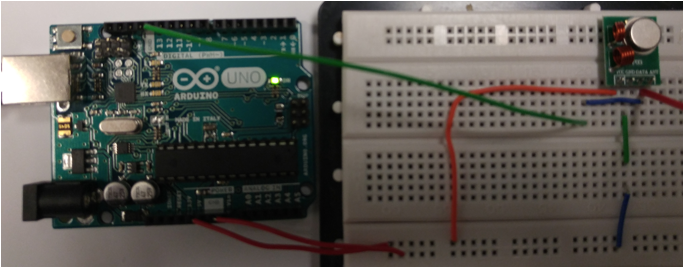
Now let's try switching on/off the Tx module with Arduino. This is just to test basic operation with Arduino. There is nothing fancy about it. This is just to replace the small switch and my finger with Arduino. The circuit and connection with Arduino is as shown below.
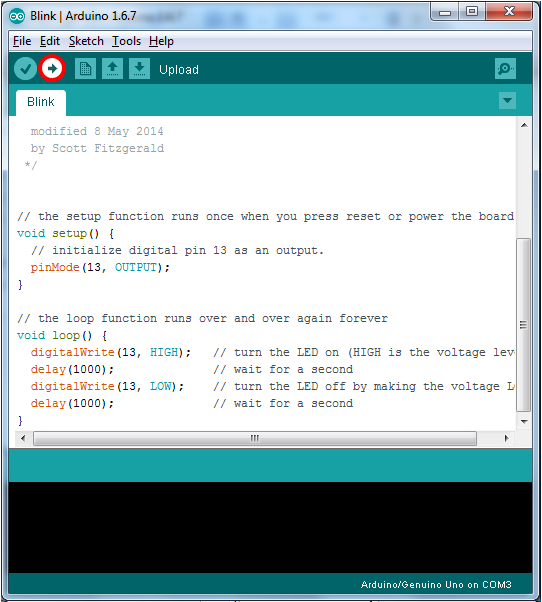
For programming, I didnt' do any programming. I just used the simplest Arduino sample sketch (Blink) as shown below. (Actually I connected the Tx module so that I can use this script without any modification).
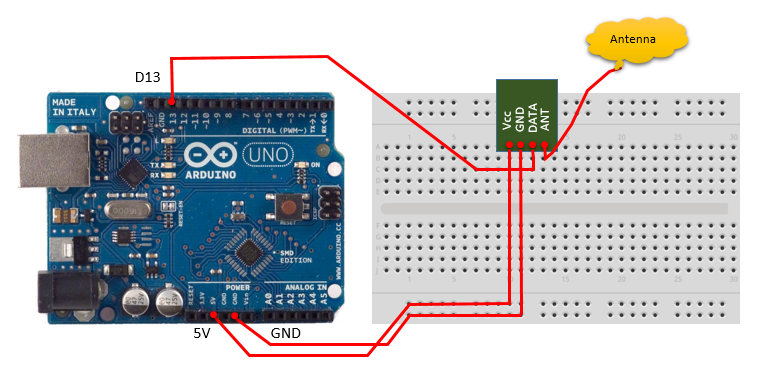
I know the picture for real connection shown above would look messy. The connection in a little bit tidy form can be illustrated as shown below. NOTE : You may be wondering what kind of Antenna you use. Don't worry, just use a segment of wire. In fact, even without any antenna this tutorial would work.
To check out the signal transmitted by the Tx module, I used RTL device and SDR Sharp setup as shown below.
Run the Arduino program. If you see something as shown below, you can say it works as intended.
|
||