The uplink constellation of a WCDMA UE looks different from the downlink one, and it changes with every channel the UE adds. This page shows three measured cases: a Release 99 RMC, an RMC with HSDPA feedback, and HSUPA with SF2. Let's first see how the UE builds its uplink signal, because every pattern below follows from that.
- How does the UE build its uplink signal ?
- LoopMode 1 – RMC, PN9
- LoopMode 1 – FRC,HSET3-QPSK
- HSUPA - 2ms, SF2
- Reference
How does the UE build its uplink signal ?
The downlink sums many QPSK channels, but the uplink works differently. Each uplink code channel carries BPSK on either the I branch or the Q branch. The UE then adds the branches and scrambles the result with a complex code.
In 25.213, the DPCCH is always spread by Cch,256,0. When the UE sends one DPDCH, the DPDCH is spread by Cch,SF,SF/4 and goes on the I branch, while the DPCCH goes on the Q branch. Each channel has its own gain factor, so the DPDCH amplitude is βd and the DPCCH amplitude is βc. Before scrambling, one chip is therefore one of four values: +/-βd +/- jβc.
The scrambling step changes the picture. The uplink scrambling code is complex, and each of its chips has the form +/-1 +/- j. Multiplying by such a chip rotates the point by an odd multiple of 45 degrees. If βd and βc differ, the four points and their rotations give 8 different points, all on one circle. Adding one more channel on a branch, such as the HS-DPCCH, gives that branch more amplitude levels, so the number of points grows again.
The analyzer screens below come in pairs. The first screen of each pair is the composite view, with the chip-level constellation and EVM versus chip. The second is the code domain view, which despreads each channel and shows its own BPSK constellation.
Each uplink code channel is BPSK : the code domain view shows two points on one axis for every active channel.I and Q carry different channels : the DPDCH is on I and the DPCCH on Q, with different gain factors.Complex scrambling creates the composite pattern : unequal βd and βc give 8 points on a circle instead of 4.
LoopMode 1 – RMC, PN9
The first case is the simplest uplink: an RMC in loopback mode 1, with a PN9 data pattern. Only two uplink channels are active, one DPDCH and the DPCCH. So this case should show the 8 point pattern from the previous section.
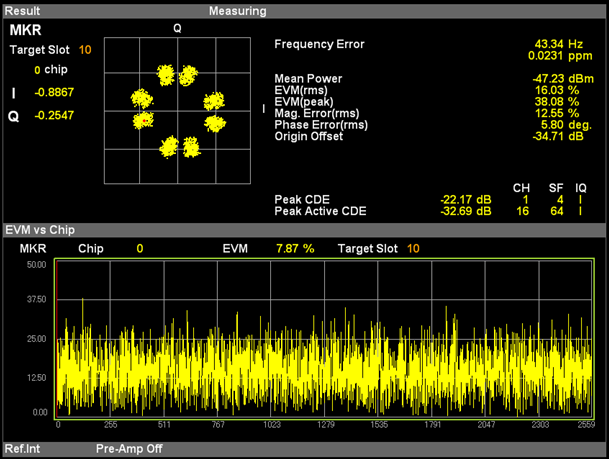
Figure 1. Composite view of the RMC uplink. Two BPSK channels with different gain factors give 8 clusters on a circle.
- The constellation in the upper left shows 8 clusters of points, spaced evenly around a circle.
- The readout on the right shows a mean power of -47.23 dBm, EVM of 16.03 % rms and 38.08 % peak, and an origin offset of -34.71 dB.
- Peak CDE is -22.17 dB on channel 1 at SF4 on I, and the peak active CDE is -32.69 dB on channel 16 at SF64 on I.
- The EVM versus chip plot covers chips 0 to 2559, which is one slot of 2560 chips, for target slot 10.
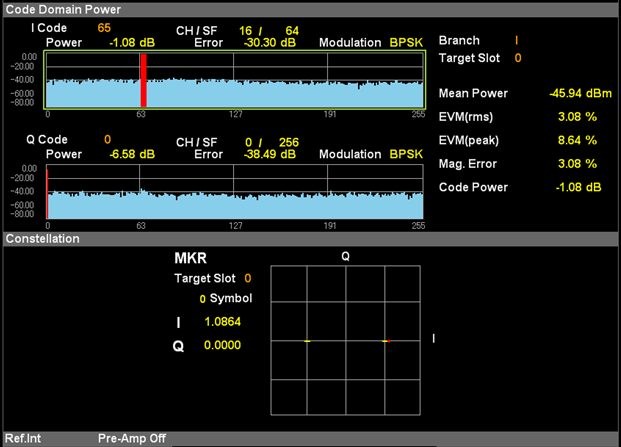
Figure 2. Code domain view of the RMC uplink. The DPDCH on the I branch and the DPCCH on the Q branch are the only active codes, and each carries BPSK.
- On the I branch, the red bar is CH/SF 16/64 with a code power of -1.08 dB. This is the DPDCH on Cch,64,16, which matches Cch,SF,SF/4 for SF 64.
- On the Q branch, the only active code is CH/SF 0/256 with a power of -6.58 dB. This is the DPCCH on Cch,256,0.
- The code domain EVM of the DPDCH is 3.08 % rms, and its constellation shows two points on the I axis.
The two power readouts give the gain factor ratio directly. The DPCCH is 5.5 dB below the DPDCH, which is an amplitude ratio βc/βd of about 0.53. This matches the DPCCH/DPDCH power ratio of -5.46 dB in 25.101 Table A.1 for the 12.2 kbps UL RMC, whose 60 kbps DPDCH uses SF64. Because the ratio is not 1, the composite view shows 8 clusters rather than 4.
The two EVM values need care. The composite EVM is 16.03 %, while the code domain EVM of the DPDCH is only 3.08 %. The mean power is also far below the -20 dBm that 25.101 uses for its 17.5 % EVM limit. So the composite value here does not show whether the UE meets that requirement.
Cch,64,16 on I is the DPDCH : for one DPDCH the code number is always SF/4.The power gap gives βc/βd : 5.5 dB here means an amplitude ratio of about 0.53, as the 12.2 kbps RMC specifies.Compare EVM at the test power : the 17.5 % limit of 25.101 applies at the output power of its Table 6.15.
LoopMode 1 – FRC,HSET3-QPSK
The second case adds HSDPA to the loopback. The UE now sends the HS-DPCCH with ACK, NACK and CQI next to the DPDCH and the DPCCH. Watch how one extra channel on the Q branch doubles the number of clusters.
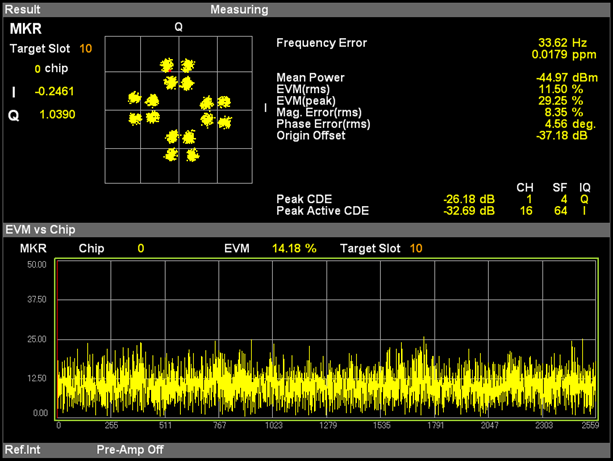
Figure 3. Composite view with the HS-DPCCH added. Each of the 8 RMC clusters splits into two, so the constellation shows 16 clusters.
- The constellation now shows 8 pairs of clusters on a circle, 16 clusters in total.
- The readout shows a mean power of -44.97 dBm, EVM of 11.50 % rms and 29.25 % peak, and an origin offset of -37.18 dB.
- Peak CDE is -26.18 dB on channel 1 at SF4 on Q, and the peak active CDE is again -32.69 dB on channel 16 at SF64 on I.
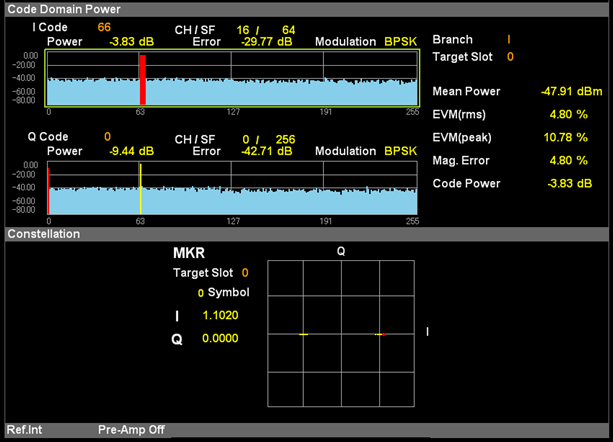
Figure 4. Code domain view with the HS-DPCCH added. A second active code appears on the Q branch next to the DPCCH.
- On the I branch, the DPDCH is again CH/SF 16/64, now with a code power of -3.83 dB and a code domain EVM of 4.80 % rms.
- On the Q branch, the DPCCH is CH/SF 0/256 at -9.44 dB. A second yellow bar stands near code 64 of the SF256 axis.
- In 25.213 Table 1D, the HS-DPCCH uses Cch,256,64 when the UE has one DPDCH, so this second bar is the HS-DPCCH.
Now the Q branch carries two channels, the DPCCH and the HS-DPCCH. Their sum has two amplitude levels, +/-(βc + βhs) and +/-(βc - βhs). Each of the 8 points of the RMC case therefore becomes a pair, which is exactly what the composite view shows. The HS-DPCCH fields are DTX when the UE has no HARQ-ACK or CQI to send, so the pattern can change from slot to slot.
The downlink modulation in the case name does not change the uplink constellation. The label says HSET3-QPSK, and the file name says 16QAM, but both refer to the HS-PDSCH. The uplink HS-DPCCH carries only the feedback, and it is spread and mapped the same way in both cases.
One extra Q channel doubles the clusters : the HS-DPCCH adds a second amplitude level on the Q branch.Cch,256,64 is the HS-DPCCH code with one DPDCH : the code depends on the number of DPDCHs, as 25.213 Table 1D lists.The pattern depends on the slot : the HS-DPCCH is present only when the UE sends HARQ-ACK or CQI.
HSUPA - 2ms, SF2
The last case is HSUPA with a 2 ms TTI and SF2 E-DPDCHs. SF2 is the smallest spreading factor in the uplink, so a single code takes half of the whole code tree. This is where the uplink constellation becomes dense.
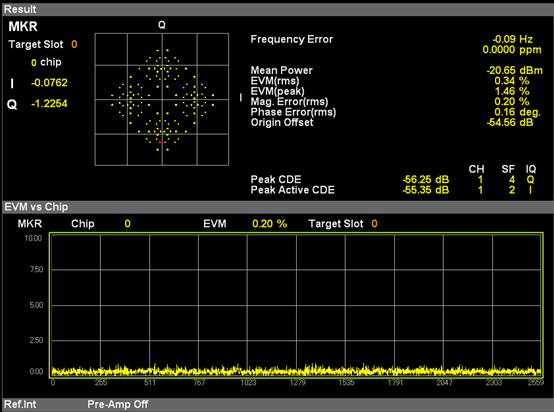
Figure 5. Composite view of HSUPA with SF2. Many channels with different gain factors fill the constellation with a dense diamond of points.
- The constellation shows many separate points, arranged roughly in a diamond around the centre.
- The readout shows a mean power of -20.65 dBm, EVM of 0.34 % rms and 1.46 % peak, and an origin offset of -54.56 dB.
- The EVM versus chip plot is almost flat near zero, and its scale is only 0 to 10 %.
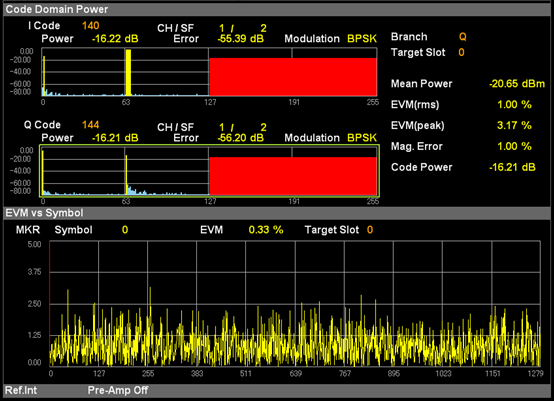
Figure 6. Code domain view of HSUPA with SF2. A red block fills codes 128 to 255 on both branches, which is the code space of Cch,2,1.
- The marker reads CH/SF 1/2 on both branches, with a code power of -16.22 dB on I and -16.21 dB on Q.
- Code 1 at SF2 covers codes 128 to 255 of the SF256 axis, so the red block is one E-DPDCH on each branch.
- Narrow yellow bars at low code numbers and near code 64 are the control channels.
- The lower plot shows EVM versus symbol for the selected code, with 0.33 % EVM at symbol 0.
25.213 explains the two red blocks. Without a DPDCH, 25.213 Table 1E gives Cch,2,1 to both E-DPDCH1 and E-DPDCH2 when SF is 2. Table 1C maps E-DPDCH1 to the I branch and E-DPDCH2 to the Q branch. So a 2xSF2 configuration uses the same code twice, once on I and once on Q.
The very low EVM stands out against the other cases. The EVM here is 0.34 %, while the loopback cases show 11 % to 16 %. Such a clean value is typical of a signal generator rather than a UE, so this capture probably shows a reference waveform. Treat it as the ideal shape of an SF2 HSUPA signal, not as the performance of a real UE.
2xSF2 uses Cch,2,1 on both I and Q : the same code carries E-DPDCH1 on I and E-DPDCH2 on Q.More channels give a denser constellation : E-DPDCHs, E-DPCCH, HS-DPCCH and DPCCH all add their own amplitude levels.Check the source before comparing EVM : a generator waveform and a UE in loopback give very different values.
Reference
- 3GPP TS 25.213 v19.0.0 - subclause 4.2 uplink spreading, Table 1C IQ branch mapping for E-DPDCH, Table 1D channelisation code of HS-DPCCH, Table 1E channelisation code for E-DPDCH
- 3GPP TS 25.101 v19.0.0 - subclause 6.8.2 Error Vector Magnitude and Table 6.15, Annex A.2.1 Table A.1 UL reference measurement channel 12.2 kbps