A UMTS UE can report how much total power it receives on a carrier. This quantity is the UTRA carrier RSSI, and the UE does not send it in dBm. It sends an integer, and the network turns that integer back into a power range with a table from 25.133. This page gives that table in full, and then explains what the UE measures and where the value appears in a measurement report.
- What does the UTRA carrier RSSI measure ?
- How does a reported value map to dBm ?
- Where does the UE report the RSSI ?
- Reference
What does the UTRA carrier RSSI measure ?
Before reading the mapping table, it helps to know what the number stands for. RSSI is not the power of one cell. It is everything the UE antenna picks up on the carrier, so it grows with the load of the whole network, not only with the signal of the serving cell.
25.215 subclause 5.1.3 defines the UTRA carrier RSSI as the received wide band power, including thermal noise and noise generated in the receiver, within the bandwidth defined by the receiver pulse shaping filter. The reference point is the antenna connector of the UE. With receiver diversity, the reported value must not be lower than the RSSI of any single receive branch. The measurement applies to CELL_DCH, for both intra-frequency and inter-frequency use.
So RSSI adds up three things: the power of every cell the UE hears on that carrier, the thermal noise, and the noise of the UE receiver. This is the same quantity as Io, the total received power density. It is also the denominator of CPICH Ec/Io. Without receiver diversity, 25.215 subclause 5.1.5 makes CPICH Ec/No identical to CPICH RSCP divided by UTRA carrier RSSI. For example, a CPICH RSCP of -80 dBm with an RSSI of -70 dBm gives an Ec/Io of -10 dB.
25.133 subclause 9.1.3 notes that the measurement is for inter-frequency handover evaluation. It also sets how exact the value has to be. Table 9.10 gives an absolute accuracy of +/-4 dB in normal conditions and +/-7 dB in extreme conditions. Table 9.11 gives an inter-frequency relative accuracy of +/-7 dB and +/-11 dB. Both tables apply only inside an Io range that depends on the operating band. For example, the range for Band I is -94 dBm/3.84 MHz to -70 dBm/3.84 MHz for the absolute accuracy.
RSSI is total power : it includes all cells on the carrier, the thermal noise and the receiver noise, so a high RSSI can mean a loaded carrier as well as a strong cell.RSSI links RSCP and Ec/Io : Ec/Io in dB is RSCP in dBm minus RSSI in dBm, when the UE does not use receiver diversity.The accuracy is coarse : a +/-4 dB tolerance is wider than one step of the report table, so two adjacent reported values do not prove a real difference in power.
How does a reported value map to dBm ?
The UE reports RSSI as a level number from 0 to 76. Each number stands for a 1 dB wide power range, except the two ends of the table. So the question for this section is how to turn the number in a log back into dBm.
Following table comes from 25.133.
The screenshot below is 25.133 Table 9.12 from subclause 9.1.3.3, UTRA Carrier RSSI measurement report mapping. The left column is the reported value, the middle column is the measured quantity range, and the right column is the unit. The middle rows are left out in the specification, as the dots show.
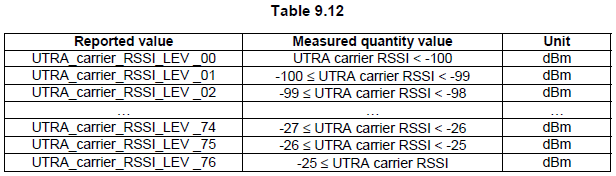
25.133 Table 9.12. The reported value counts up in 1 dB steps from -100 dBm to -25 dBm, and the two end values are open ranges.
UTRA_carrier_RSSI_LEV _00 : any RSSI below -100 dBm. The UE cannot say how far below.UTRA_carrier_RSSI_LEV _01 to _75 : each value covers one 1 dB range. The lower edge is included and the upper edge is not.UTRA_carrier_RSSI_LEV _76 : any RSSI of -25 dBm or more.The same table in the current release : 25.133 v19.0.0 still carries this table as Table 9.12 in subclause 9.1.3.3, with a reporting range of -100 dBm to -25 dBm.
Just to save a little bit of time for readers, I expanded the table to show all the possible RSSI value and mapping absolute power.
In the expanded table below, the From column is the lower edge and it is included. The To column is the upper edge and it is not included. So the row 45 means -56 dBm <= RSSI < -55 dBm. In general, a reported value N from 1 to 75 means (N - 101) dBm <= RSSI < (N - 100) dBm.
|
RSSI |
From |
To |
Unit |
|
00 |
-100.0 |
dBm |
|
|
01 |
-100.0 |
-99.0 |
dBm |
|
02 |
-99.0 |
-98.0 |
dBm |
|
03 |
-98.0 |
-97.0 |
dBm |
|
04 |
-97.0 |
-96.0 |
dBm |
|
05 |
-96.0 |
-95.0 |
dBm |
|
06 |
-95.0 |
-94.0 |
dBm |
|
07 |
-94.0 |
-93.0 |
dBm |
|
08 |
-93.0 |
-92.0 |
dBm |
|
09 |
-92.0 |
-91.0 |
dBm |
|
10 |
-91.0 |
-90.0 |
dBm |
|
11 |
-90.0 |
-89.0 |
dBm |
|
12 |
-89.0 |
-88.0 |
dBm |
|
13 |
-88.0 |
-87.0 |
dBm |
|
14 |
-87.0 |
-86.0 |
dBm |
|
15 |
-86.0 |
-85.0 |
dBm |
|
16 |
-85.0 |
-84.0 |
dBm |
|
17 |
-84.0 |
-83.0 |
dBm |
|
18 |
-83.0 |
-82.0 |
dBm |
|
19 |
-82.0 |
-81.0 |
dBm |
|
20 |
-81.0 |
-80.0 |
dBm |
|
21 |
-80.0 |
-79.0 |
dBm |
|
22 |
-79.0 |
-78.0 |
dBm |
|
23 |
-78.0 |
-77.0 |
dBm |
|
24 |
-77.0 |
-76.0 |
dBm |
|
25 |
-76.0 |
-75.0 |
dBm |
|
26 |
-75.0 |
-74.0 |
dBm |
|
27 |
-74.0 |
-73.0 |
dBm |
|
28 |
-73.0 |
-72.0 |
dBm |
|
29 |
-72.0 |
-71.0 |
dBm |
|
30 |
-71.0 |
-70.0 |
dBm |
|
31 |
-70.0 |
-69.0 |
dBm |
|
32 |
-69.0 |
-68.0 |
dBm |
|
33 |
-68.0 |
-67.0 |
dBm |
|
34 |
-67.0 |
-66.0 |
dBm |
|
35 |
-66.0 |
-65.0 |
dBm |
|
36 |
-65.0 |
-64.0 |
dBm |
|
37 |
-64.0 |
-63.0 |
dBm |
|
38 |
-63.0 |
-62.0 |
dBm |
|
39 |
-62.0 |
-61.0 |
dBm |
|
40 |
-61.0 |
-60.0 |
dBm |
|
41 |
-60.0 |
-59.0 |
dBm |
|
42 |
-59.0 |
-58.0 |
dBm |
|
43 |
-58.0 |
-57.0 |
dBm |
|
44 |
-57.0 |
-56.0 |
dBm |
|
45 |
-56.0 |
-55.0 |
dBm |
|
46 |
-55.0 |
-54.0 |
dBm |
|
47 |
-54.0 |
-53.0 |
dBm |
|
48 |
-53.0 |
-52.0 |
dBm |
|
49 |
-52.0 |
-51.0 |
dBm |
|
50 |
-51.0 |
-50.0 |
dBm |
|
51 |
-50.0 |
-49.0 |
dBm |
|
52 |
-49.0 |
-48.0 |
dBm |
|
53 |
-48.0 |
-47.0 |
dBm |
|
54 |
-47.0 |
-46.0 |
dBm |
|
55 |
-46.0 |
-45.0 |
dBm |
|
56 |
-45.0 |
-44.0 |
dBm |
|
57 |
-44.0 |
-43.0 |
dBm |
|
58 |
-43.0 |
-42.0 |
dBm |
|
59 |
-42.0 |
-41.0 |
dBm |
|
60 |
-41.0 |
-40.0 |
dBm |
|
61 |
-40.0 |
-39.0 |
dBm |
|
62 |
-39.0 |
-38.0 |
dBm |
|
63 |
-38.0 |
-37.0 |
dBm |
|
64 |
-37.0 |
-36.0 |
dBm |
|
65 |
-36.0 |
-35.0 |
dBm |
|
66 |
-35.0 |
-34.0 |
dBm |
|
67 |
-34.0 |
-33.0 |
dBm |
|
68 |
-33.0 |
-32.0 |
dBm |
|
69 |
-32.0 |
-31.0 |
dBm |
|
70 |
-31.0 |
-30.0 |
dBm |
|
71 |
-30.0 |
-29.0 |
dBm |
|
72 |
-29.0 |
-28.0 |
dBm |
|
73 |
-28.0 |
-27.0 |
dBm |
|
74 |
-27.0 |
-26.0 |
dBm |
|
75 |
-26.0 |
-25.0 |
dBm |
|
76 |
-25.0 |
dBm |
When you read a log, one subtraction is enough. Take the reported value and subtract 101 to get the lower edge in dBm. A value of 30 therefore means -71 dBm <= RSSI < -70 dBm. A value of 0 or 76 gives only a bound, because these two rows have one open edge.
Lower edge in dBm is N - 101 : for any reported value N from 1 to 76.Values 0 and 76 are open ranges : 0 is below -100 dBm and 76 is -25 dBm or more.The step is 1 dB : this is finer than the accuracy of the measurement itself, so read small changes with care.
Where does the UE report the RSSI ?
The mapping table only helps once you have found the number in a message. In 25.331 the RSSI is not reported for every measurement. The network has to ask for it, and it arrives inside the inter-frequency part of a MEASUREMENT REPORT.
The network asks for it in InterFreqReportingQuantity, which is part of the inter-frequency measurement in a MEASUREMENT CONTROL. When the Boolean utra-Carrier-RSSI is TRUE, the UE adds the IE utra-CarrierRSSI for each reported frequency in InterFreqMeasuredResults. The listing below shows the three definitions from the current 25.331.
Following is based on
InterFreqReportingQuantity ::=		SEQUENCE {
	utra-Carrier-RSSI					BOOLEAN,
	frequencyQualityEstimate			BOOLEAN,
	nonFreqRelatedQuantities			CellReportingQuantities
}

InterFreqMeasuredResults ::=		SEQUENCE {
	frequencyInfo						FrequencyInfo						OPTIONAL,
	utra-CarrierRSSI					UTRA-CarrierRSSI					OPTIONAL,
	interFreqCellMeasuredResultsList	InterFreqCellMeasuredResultsList	OPTIONAL
}

-- SPARE: UTRA-CarrierRSSI, Max = 76
-- Values above Max are spare
UTRA-CarrierRSSI ::=				INTEGER (0..127)
UTRA-CarrierRSSI is an INTEGER from 0 to 127, but the comment above it says that only 0 to 76 are used. Values 77 to 127 are spare. So the ASN.1 range is wider than the 25.133 table, and a value above 76 in a log points to a decoding problem or a UE error, not to a very strong signal.
The RSSI is reported per frequency, not per cell. InterFreqMeasuredResults carries one frequencyInfo, one optional utra-CarrierRSSI and then the list of cells on that frequency. So a report with three cells on one inter-frequency carrier still carries at most one RSSI value for that carrier.
The network must ask for it : utra-Carrier-RSSI in InterFreqReportingQuantity turns the report on.One value per carrier : utra-CarrierRSSI sits next to frequencyInfo in InterFreqMeasuredResults, outside the per-cell list.Only 0 to 76 are valid : the ASN.1 allows up to 127, but 25.331 marks 77 to 127 as spare.
Reference
- 3GPP TS 25.133 : Requirements for support of radio resource management (FDD), v19.0.0. Subclause 9.1.3, Tables 9.10, 9.11 and 9.12.
- 3GPP TS 25.215 : Physical layer; Measurements (FDD), v19.0.0. Subclauses 5.1.3 and 5.1.5.
- 3GPP TS 25.331 : Radio Resource Control (RRC); Protocol specification, v19.0.1. ASN.1 of InterFreqReportingQuantity, InterFreqMeasuredResults and UTRA-CarrierRSSI.