Cluster - pyTorch
In this note, I want to try to apply an approach that is completely from other notes. I wanted to use chatGPT to create a Python code that I want instead of writing it myself.
NOTE : Refer to this note for my personal experience with chatGPT coding and advtantage & limitation of the tool. In general, I got very positive impression with chatGPT utilization for coding.
This code is created first by chatGPT on Feb 03 2023 (meaning using chatGPT 3.5). For this code, I haven't started from the requirement. I asked chatGPT to write the same function as this using pyTorch.
As you notice, this code uses some math function of torch, but does not use any neural net.
NOTE : To my surprise (in negative way), chatGPT coding was a little bit disappointing in terms of pyTorch coding. It seems chatGPT became dumb. In most case, the initial response was the code with syntax errors and when I said 'fix it' it rewrite the entire code in complete different way instead of the fixing a specific part and the new code generates other syntax error. At first, I thought chatGPT would write stable, high quality Python code because I assumed that it has been trained most extensively for Python because I thought there are the most amount of python code shared by gitHub or stackoverflow etc.
|
Cluster_kCluster_PyTorch_01.py |
|
import torch import matplotlib.pyplot as plt
def kmeans(data, n_clusters, n_init=10, max_iter=300, tol=0.0001, random_state=0):
data = torch.tensor(data, dtype=torch.float32) num_points, num_dims = data.shape
# initialize cluster centroids randomly centroids = data[torch.randperm(num_points)[:n_clusters]]
for i in range(max_iter): # calculate distances between each point and the centroids distances = torch.stack([((data - centroids[j])**2).sum(dim=1) for j in range(n_clusters)])
# find the closest centroid for each data point closest_centroids = distances.argmin(dim=0)
# update the centroids to be the mean of the data points assigned to them new_centroids = torch.stack([data[closest_centroids == j].mean(dim=0) for j in range(n_clusters)])
# check if the centroids have changed if (new_centroids - centroids).abs().max() < tol: break centroids = new_centroids
return closest_centroids, centroids
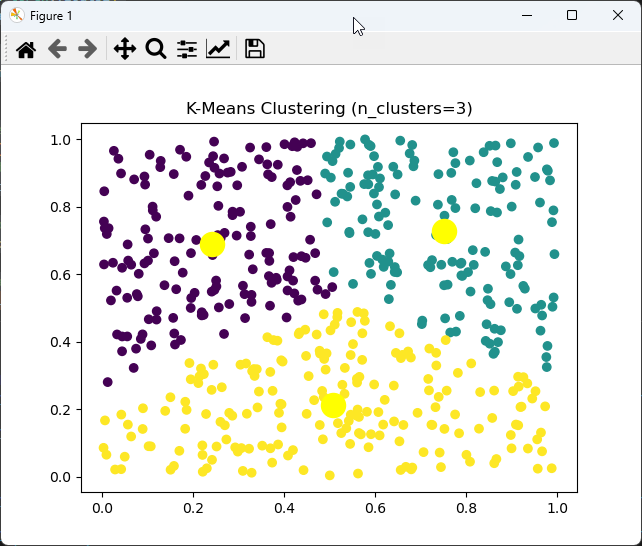
def display_result(X, y_pred, n_clusters, centroids): X = torch.tensor(X, dtype=torch.float32) plt.scatter(X[:, 0], X[:, 1], c=y_pred) plt.scatter(centroids[:, 0], centroids[:, 1], s=300, c='yellow', label='Centroids') plt.title(f'K-Means Clustering (n_clusters={n_clusters})') plt.show()
def test_kmeans(): # Generate random sample data with 100 samples and 2 features n_samples = 500 n_features = 2 X = torch.rand(n_samples, n_features).numpy() n_clusters = 3
# Call the kmeans function labels, centroids = kmeans(X, n_clusters)
# Assert that the shape of the labels is correct assert labels.shape == (n_samples,), f"Expected shape {(n_samples,)}, but got {labels.shape}"
# Assert that the shape of the centroids is correct assert centroids.shape == (n_clusters, n_features), f"Expected shape {(n_clusters, n_features)}, but got {centroids.shape}"
# Display the result display_result(X, labels, n_clusters, centroids)
test_kmeans()
|
The result from this code is as follows :
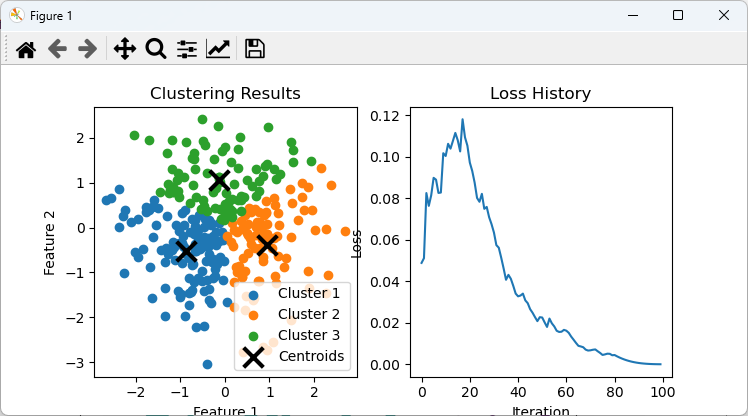
I asked chatGPT to use 'feedforward neural net' and got the same code and plot clustered output and loss values in the same figure.
NOTE : I expected a little bit different code from this. I expected chatGPT to use multiple layers of linear layers but the result is not what I expected. Probably the term 'feedforward' in my request was interpreted differently. But the outcome of the execution is exactly what I wanted get.
|
Cluster_kCluster_PyTorch_NN_01.py |
|
import torch import torch.nn as nn import torch.optim as optim import numpy as np import matplotlib.pyplot as plt
def k_means_clustering_nn(X, n_clusters, n_iter=100): X = torch.tensor(X, dtype=torch.float32) n_samples, n_features = X.shape centroids = torch.randn((n_clusters, n_features), dtype=torch.float32) cluster_assignment = torch.zeros((n_samples,), dtype=torch.int64) loss_hist = []
class KMeansClusteringNN(nn.Module): def __init__(self): super(KMeansClusteringNN, self).__init__() self.centroids = nn.Parameter(torch.randn((n_clusters, n_features), dtype=torch.float32))
def forward(self, X): X = X.unsqueeze(1) distances = (X - self.centroids)**2 distances = torch.sum(distances, dim=2) cluster_assignment = torch.argmin(distances, dim=1) return cluster_assignment
model = KMeansClusteringNN() optimizer = optim.Adam(model.parameters(), lr=1e-2) for i in range(n_iter): optimizer.zero_grad() cluster_assignment = model(X) loss = 0 for c in range(n_clusters): points_in_cluster = X[cluster_assignment == c] mean_of_points = torch.mean(points_in_cluster, dim=0) centroids_loss = torch.sum((mean_of_points - model.centroids[c])**2) loss += centroids_loss loss /= n_clusters loss.backward() optimizer.step() loss_hist.append(loss.item())
with torch.no_grad(): final_cluster_assignment = model(X) final_centroids = model.centroids.detach().numpy()
return final_centroids, final_cluster_assignment.numpy(), loss_hist
# generate sample data np.random.seed(0) X = np.random.randn(300, 2) n_clusters = 3 centroids, cluster_assignment, loss_hist = k_means_clustering_nn(X, n_clusters)
fig, ax = plt.subplots(1, 2, figsize=(12, 4))
# plot clustering results for c in range(n_clusters): points_in_cluster = X[cluster_assignment == c] ax[0].scatter(points_in_cluster[:, 0], points_in_cluster[:, 1], label=f'Cluster {c+1}') ax[0].scatter(centroids[:, 0], centroids[:, 1], marker='x', color='k', s=200, linewidth=3, label='Centroids') ax[0].set_xlabel('Feature 1') ax[0].set_ylabel('Feature 2') ax[0].set_title('Clustering Results') ax[0].legend()
# plot loss history ax[1].plot(loss_hist) ax[1].set_xlabel('Iteration') ax[1].set_ylabel('Loss') ax[1].set_title('Loss History')
plt.show()
|
The result from this code is as follows :