In this page, I will try to describe UMTS RF measurement procedure ( Purpose, Meaning of the test, Interpretation of the result) in my own language and in my understanding.
The tests on this page come from 3GPP TS 34.121-1, the RF conformance specification for the UMTS FDD UE. The page starts with the list of test cases and the equipment each one needs. Then comes the H-Set table, which the HSDPA tests refer to. The last part walks through the procedure of seven transmitter tests, from 5.2B to 5.7A. Most of them are shown as a signalling sequence between the UE and the SS, followed by the power profile that the SS measures.
- 34.121-1 RF Conformance Test Case List
- HSet Definition Table
- Measurement Procedure
- 5.2B Maximum Output Power with HS-DPCCH and E-DCH
- 5.2C UE Relative Code Domain Power Accuracy - Release 6 and later
- 5.4.1 Open Loop Power Control in the Uplink
- 5.5 Transmit ON/OFF Power
- 5.6 Change of TFC
- 5.7 Power setting in uplink compressed mode
- 5.7A HS-DPCCH Power Control
- Reference
34.121-1 RF Conformance Test Case List
TS 34.121-1 groups its test cases by chapter, and the first table below lists those chapters. The three tables after it list the test cases of chapters 5, 6 and 7. Their last column, Eq Config, says which test equipment each test case needs. The Equipment Configuration table at the end of this section explains those numbers.
|
Chapter |
Description |
|
5 |
Transmitter Characteristics |
|
6 |
Receiver Characteristics |
|
7 |
Performance requirements |
|
8 |
Requirements for support of RRM |
|
9 |
Performance requirements for HSDPA |
|
10 |
Performance requirement (E-DCH) |
5. Transmitter Characteristics
Chapter 5 tests what the UE transmits: its output power, its frequency error, its power control and the quality of its modulation. Almost all of these tests need only configuration 1, the basic call box, because the call box itself measures the uplink signal.
Chap 5 |
Transmitter Characteristics |
Eq Config |
5.2 |
Maximum Output Power |
1 |
5.2A |
Maximum Output Power with HSDPCCH (Release 5 only) |
1 |
5.2AA |
Maximum Output Power with HSDPCCH (Release 6 and later) |
1 |
5.2B |
Maximum Output Power with HSDPCCH and EDCH |
1 |
5.2C |
UE relative code domain power accuracy |
1 |
5.2D |
UE Relative Code Domain Power Accuracy for HS-DPCCH and EDCH |
1 |
5.2E |
UE Relative Code Domain Power Accuracy for HS-DPCCH and E-DCH with 16QAM |
1 |
5.3 |
Frequency Error |
1 |
5.4 |
Output Power Dynamics in Uplink |
1 |
5.4.1 |
Open Loop Power Control in Uplink |
1 |
5.4.2 |
Inner Loop Power Control in Uplink |
1 |
5.4.3 |
Minimum Output Power |
1 |
5.4.4 |
Outofsynchronisation handling of output power |
1 |
5.5 |
Transmit ON/OFF Power |
1 |
5.6 |
Change of TFC |
1 |
5.7 |
Power setting in uplink compressed mode |
CT |
5.7A |
HSDPCCH (Rel6) |
1 |
5.7A |
HSDPCCH Power Control (Rel7 and later) |
1 |
5.8 |
Occupied Bandwidth (OBW) |
1 |
5.9 |
Spectrum emission mask |
1 |
5.9A |
Spectrum Emission Mask with HSDPCCH |
1 |
5.9B |
Spectrum Emission Mask with EDCH |
1 |
5.10 |
Adjacent Channel Leakage Power Ratio (ACLR) |
1 |
5.10A |
Adjacent Channel Leakage Power Ratio (ACLR) with HSDPCCH |
1 |
5.10B |
Adjacent Channel Leakage Power Ratio (ACLR) with EDCH |
1 |
5.11 |
Spurious Emissions |
1,3 |
5.12 |
Transmit Intermodulation Requires SG and SPA |
1,2,3 |
5.13 |
Transmit Modulation |
- |
5.13.1 |
Error Vector Magnitude (EVM) |
1 |
5.13.1A |
Error Vector Magnitude (EVM) with HSDPCCH (Rel6) |
1 |
5.13.1A |
Error Vector Magnitude (EVM) with HSDPCCH (Rel7 and later) |
1 |
5.13.1AA |
Error Vector Magnitude (EVM) and phase discontinuity with HSDPCCH |
1 |
5.13.1AAA |
EVM and IQ origin offset for HS-DPCCH and E-DCH with 16 QAM |
1 |
5.13.2 |
Peak code domain error |
1 |
5.13.2A |
Relative Code Domain Error with HS-DPCCH |
1 |
5.13.2B |
Relative Code Domain Error with HS-DPCCH and E-DCH |
1 |
5.13.2C |
Relative Code Domain Error for HS-DPCCH and E-DCH with 16QAM |
1 |
5.13.3 |
UE phase discontinuity |
1 |
5.13.4 |
PRACH preamble quality |
1 |
6. Reciever Characteristics
Chapter 6 tests how well the UE receives. The SS sends the downlink at a defined level, and the UE loops the data back so that the SS can count the errors. Tests with an interfering signal, such as ACS, blocking and intermodulation, also need a signal generator, which is configuration 2.
Chap 6 |
Receiver Characteristics |
Eq Config |
6.2 |
Reference Sensitivity Level |
1 |
6.2A |
Reference Sensitivity Level for DC-HSDPA |
1 |
6.2B |
Reference Sensitivity Level for DB-DC-HSDPA |
CT |
6.3 |
Maximum Input Level |
1 |
6.3A |
Maximum Input Level for HSPDSCH Reception (16QAM) |
1 |
6.3B |
Maximum Input Level for HS-PDSCH Reception (64QAM) |
1 |
6.3C |
Maximum Input Level for DC-HSDPA Reception (16QAM) |
1 |
6.3D |
Maximum Input Level for DC-HSDPA Reception (64QAM) |
1 |
6.3E |
Maximum Input Level for DB-DC-HSDPA Reception(16QAM) |
CT |
6.3F |
Maximum Input Level for DB-DC-HSDPA Reception(64QAM) |
CT |
6.4 |
Adjacent Channel Selectivity (ACS) |
1,2 |
6.5 |
Blocking Characteristics |
1,2 |
6.5A |
Blocking Characteristics for DC-HSDPA |
1,2 |
6.5B |
Blocking Characteristics for DB-DC-HSDPA |
CT |
6.6 |
Spurious Response |
1,2 |
6.6A |
Spurious Response for DC-HSDPA |
1,2 |
6.6B |
Spurious Response for DB-DC-HSDPA |
CT |
6.7 |
Intermodulation Characteristics |
1,2 |
6.7A |
Intermodulation Characteristics for DC-HSDPA |
1,2 |
6.7B |
Intermodulation Characteristics for DB-DC-HSDPA |
CT |
6.8 |
Spurious Emissions |
1,3 |
7. Performance Requirements
Chapter 7 tests demodulation under defined propagation conditions. The multipath, moving and birth-death tests need a fading simulator, which is configuration 4. The later tests, such as handover, downlink power control and compressed mode, need a full conformance test system, marked CT.
Chap 7 |
Performance requirements |
Eq Config |
7.2 |
Demodulation in Static Propagation conditions |
1 |
7.3 |
Demodulation of DCH in Multipath Fading Propagation conditions |
1,4 |
7.4 |
Demodulation of DCH in Moving Propagation conditions Requires |
1,4 |
7.5 |
Demodulation of DCH in BirthDeath Propagation conditions |
1,4 |
7.5A |
Demodulation of DCH in high speed train condition |
CT |
7.6 |
Demodulation of DCH in downlink Transmit diversity modes |
CT |
7.7 |
Demodulation in Handover conditions |
CT |
7.8 |
Power control in downlink |
CT |
7.9 |
Downlink compressed mode |
CT |
7.10 |
Blind Transport format detection |
CT |
7.11 |
Demodulation of Paging Channel (PCH) |
CT |
7.12 |
Detection of Acquisition Indicator (AI) |
CT |
7.12A |
Detection of E-DCH Acquisition Indicator (E-AI) |
CT |
7.13 |
UE UL power control operation with discontinuous UL DPCCH transmission operation |
CT |
Equipment Configuration
The numbers in the Eq Config column of the tables above refer to this list. A test marked 1,2 needs a call box and a signal generator together. A test marked CT needs a full conformance test system rather than a set of separate instruments.
No |
Equipment Type |
1 |
Basic Call Box |
2 |
Signal Generator |
3 |
Spectrum Analyzer |
4 |
Fading Simulator |
CT |
Full Conformance Test System |
HSet Definition Table
An H-Set is a Fixed Reference Channel for the HSDPA tests. Each set fixes the modulation, the number of HS-PDSCH codes, the inter-TTI distance and the number of HARQ processes. So every test system sends the same HSDPA signal, and a result from one system can be compared with a result from another.
For the details of each HSET, refer to 3GPP TS 25.101 Annex A.7”.
|
HSDPA Set of Parameters |
Avg Info Bit Rate |
TTI |
No of HARQ Process |
SML per HARQ proc |
No Of Phy Ch Code |
|
H-Set 1 (QPSK) |
534 kbps |
3 |
2 |
9600 |
5 |
|
H-Set 1 (16QAM) |
777 kbps |
3 |
2 |
9600 |
4 |
|
H-Set 2 (QPSK) |
801 kbps |
2 |
3 |
9600 |
5 |
|
H-Set 2 (16QAM) |
1166 kbps |
2 |
3 |
9600 |
4 |
|
H-Set 3 (QPSK) |
1601 kbps |
1 |
6 |
9600 |
5 |
|
H-Set 3 (16QAM) |
2332 kbps |
1 |
6 |
9600 |
4 |
|
H-Set 4 (QPSK) |
534 kbps |
2 |
2 |
7200 |
5 |
|
H-Set 5 (QPSK) |
801 kbps |
1 |
3 |
9600 |
5 |
|
H-Set 6 (QPSK) |
3219 kbps |
1 |
6 |
19200 |
10 |
|
H-Set 6 (16QAM) |
4689 kbps |
1 |
6 |
19200 |
8 |
|
H-Set 8 (64QAM) |
13252 kbps |
1 |
6 |
43200 |
15 |
|
H-Set 8A (64QAM) |
13252 kbps |
1 |
6 |
43200 |
15 |
|
H-Set 8_2 (64QAM) |
13252 kbps |
1 |
6 |
44000 |
15 |
|
H-Set 12 (QPSK) |
60 kbps |
1 |
6 |
3200 |
1 |
|
Category 6,Max. |
3649 kbps |
1 |
6 |
11200 |
5 |
|
Category 8,Max. |
7205.5 kbps |
1 |
6 |
22400 |
10 |
|
Category 9,Max. |
10125.5 kbps |
1 |
6 |
28800 |
15 |
|
Category 10,Max. |
13676 kbps |
1 |
6 |
28800 |
15 |
|
Category 13,Max. |
17640 kbps |
1 |
6 |
43200 |
15 |
|
Category 14,Max |
21096 kbps |
1 |
6 |
43200 |
15 |
|
Category 14,20M |
20352 kbps |
1 |
6 |
43200 |
15 |
|
Category 22,Max. |
27952 kbps |
1 |
6 |
28800 |
15 |
|
Category 24,Max. |
42192 kbps |
1 |
6 |
43200 |
15 |
The TTI column is the inter-TTI distance, that is how often the SS schedules the UE. H-Set 1 sends in every third TTI, so it needs only 2 HARQ processes. H-Set 3, 6 and 8 send in every TTI, so they need 6 HARQ processes. The Category rows are not H-Sets. They give the maximum rate of each HSDPA UE category for comparison. The SML per HARQ proc column is the soft buffer that each HARQ process needs, counted in soft metric locations. The UE must keep this buffer for every process, so H-Set 1 needs 2 x 9600 = 19200 SMLs in total. This is why a UE category with a small soft buffer cannot run every H-Set.
H-Set 1 QPSK is the set behind the transmitter tests on this page : 5.2B configures it, and the HS-DPCCH pattern of 5.2C and 5.7A follows its TTI.The inter-TTI distance and the HARQ process count go together : H-Set 1 sends every third TTI with 2 processes, and H-Set 3 sends every TTI with 6.The same H-Set can run with two modulations : H-Set 1, 2, 3 and 6 each have a QPSK and a 16QAM variant.
Measurement Procedure
The test cases below are all transmitter tests from chapter 5. For each one, the question is the same: how does the SS drive the UE into the condition under test, and where does it measure? The HSPA tests 5.2B, 5.2C and 5.7A are explained step by step. The older DCH tests 5.4.1 to 5.7 are shown as a signalling sequence followed by the measurement.
5.2B Maximum Output Power with HS-DPCCH and E-DCH
This test is to test HSUPA Max Tx power while UE transmit UL DPCCH, HS-DPCCH, E-DPCCH, E-DPDCH, but for this UE has to meet the following criteria.
i) UE TX power should not go higher than MAX UE Power (Max Allowed UE Power)
ii) UE has to be able to change E-TFCI value to keep its total power under MAX UE power.
iii) UE should use the Maximum possible E-TFCI in any condition.
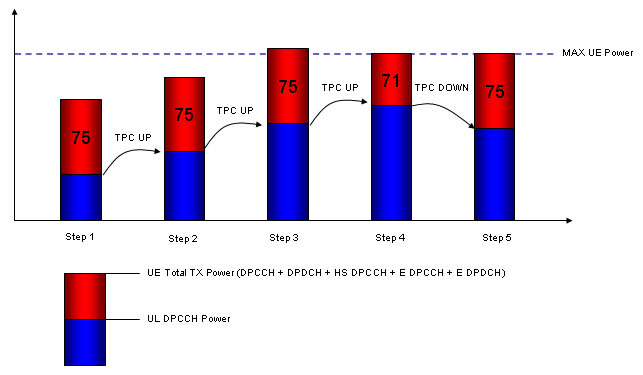
Following plot is to show a overall procedure for [subtest 1], but other subtests are also working in similar way. Only specific TFCI condition and Power Offset conditions are different. Here you see 5 steps but only the first step and last step is fixed and other steps between them is for adjusting the measurement conditions. so number of steps between the first and last step may vary depending on situation or UE.
Step 1 : Equipment send TPC commands so that UE maitains the TX power way below than the MAX UE Power (MAX allowed UE power). In this case, UE is using the largest E-TFCI since the space between current TX power and Max UE power is large enough to accommodate the E-TFCI.
Step 2 : Equipement send TPC UP command and UE sets DPCCH power incremented by 1 dB, but there is still enough space from MAX UE power. So UE is using the Max E-TFCI.
Step 3 : Equipement send TPC UP command and UE sets DPCCH power incremented by 1 dB, but there is barely enough space from MAX UE power. So UE is still using the Max E-TFCI.
Step 4 : Equipement send TPC UP command and UE sets DPCCH power incremented by 1 dB, but now the space from MAX UE power is not enough to accommodate the Max E-TFCI. So UE select a little lower TFCI which can be accommodated by the remaining power space.
Step 5 : Now Equipment send TPC DOWN command and UE sets DPCCH power decremented by 1 dB and this would give back the enough power space to accommodate the MAX E-TFCI and UE select the MAX E-TFCI again. And the equipment measure total TX power at this step and use it as pass/fail criteria.
[Common Configuration]
1. Set DPCH Timing Offset = 6
2. Set Maximum Allowed UL TX Power = 21.0 dBm.
3. Set HSUPA TTI = 10ms and Modulation = QPSK
4. Set HS-DPCCH as follows.
- CQI Feedback Cycle = 4 ms
- Ack-Nack Repetition Factor = 3
- CQI Repetition Factor = 2
5. Set TPC Algorithm = Algorithm 2
6. Select Fixed Reference Channel H-Set1 (QPSK)
[Subtest1]
1. Set Delta CQI = 8
2. Set Absolute Grant = 20
3. Set E-TFCI As follows.
|
Number of E-TFCI = 5 |
|
|
|
|
E-TFCI = 11 |
E-TFCI PO = 4 |
|
|
E-TFCI = 67 |
E-TFCI PO = 18 |
|
|
E-TFCI = 71 |
E-TFCI PO = 23 |
|
|
E-TFCI = 75 |
E-TFCI PO = 26 |
|
|
E-TFCI = 81 |
E-TFCI PO = 27 |
4. Set Beta C, Beta D, Delta ACK, Delta NAC, Delta CQI, Delta E-DPCCH as follows. (Note : This is to meet 34.121 Table C 11.1.3 requirement. Delta ACK, Delta NAC, Delta CQI are set in such way that HS-DPCCH is being transmitted with a flat power)
- Beta C = 10
- Beta D = 15
- Delta ACK = 8
- Delta NACK = 8
- Delta CQI = 8
- Delta E-DPCCH = 6
5. Send TPC so that UE transmit power is 16 dBm (which is lower than it's max power by 7.5 dB) and maintain the same power.
6. Wait 150 ms until the UE power becomes 16.0 dBm.
7. Do HSUPA Throughput measurement and confirm the E-TFCI measurement result is 75.
8. TPC_cmd = +1 and wait 150 ms.
9. Do HSUPA Throughput measurement and confirm the E-TFCI measurement result is 75.
10. Repeat step 8 to 9 until the E-TFCI measurement result is not 75.
11. TPC_cmd = -1
12. Do HSUPA Throughput measurement and confirm the E-TFCI measurement result is 75 again.
13. TPC_cmd = -1 and wait 150 ms.
14. Do HSUPA Throughput measurement and confirm the E-TFCI measurement result is 75.
15. Repeat step 13 to 14 until the E-TFCI measurement result is not 75.
16. Measure the UE Tx power and check if it is +24dBm (Tolerance +1.7/–6.7 dB).
[Subtest2]
1. Set Delta CQI = 8
2. Set Absolute Grant = 12
3. Set E-TFCI As follows.
|
Number of E-TFCI = 5 |
|
|
|
|
E-TFCI = 11 |
E-TFCI PO = 4 |
|
|
E-TFCI = 67 |
E-TFCI PO = 18 |
|
|
E-TFCI = 71 |
E-TFCI PO = 23 |
|
|
E-TFCI = 75 |
E-TFCI PO = 26 |
|
|
E-TFCI = 81 |
E-TFCI PO = 27 |
4. Set Beta C, Beta D, Delta ACK, Delta NAC, Delta CQI, Delta E-DPCCH as follows. (Note : This is to meet 34.121 Table C 11.1.3 requirement. Delta ACK, Delta NAC, Delta CQI are set in such way that HS-DPCCH is being transmitted with a flat power)
- Beta C = 6
- Beta D = 15
- Delta ACK = 8
- Delta NACK = 8
- Delta CQI = 8
- Delta E-DPCCH = 6
5. Send TPC so that UE transmit power is 16 dBm and maintain the same power.
6. Wait 150 ms until the UE power becomes 14.0 dBm.
7. Do HSUPA Throughput measurement and confirm the E-TFCI measurement result is 67.
8. TPC_cmd = +1 and wait 150 ms.
9. Do HSUPA Throughput measurement and confirm the E-TFCI measurement result is 67
10. Repeat step 8 to 9 until the E-TFCI measurement result is not 67.
11. TPC_cmd = -1
12. Do HSUPA Throughput measurement and confirm the E-TFCI measurement result is 67 again.
13. TPC_cmd = -1 and wait 150 ms.
14. Do HSUPA Throughput measurement and confirm the E-TFCI measurement result is 67.
15. Repeat step 13 to 14 until the E-TFCI measurement result is not 67.
16. Measure the UE Tx power and check if it is +22dBm (Tolerance +3.7/–5.2 dB).
[Subtest3]
1. Set Delta CQI = 8
2. Set Absolute Grant = 15
3. Set E-TFCI As follows.
|
Number of E-TFCI = 2 |
|
|
|
|
E-TFCI = 11 |
E-TFCI PO = 4 |
|
|
E-TFCI = 92 |
E-TFCI PO = 18 |
4. Set Beta C, Beta D, Delta ACK, Delta NAC, Delta CQI, Delta E-DPCCH as follows. (Note : This is to meet 34.121 Table C 11.1.3 requirement. Delta ACK, Delta NAC, Delta CQI are set in such way that HS-DPCCH is being transmitted with a flat power)
- Beta C = 15
- Beta D = 9
- Delta ACK = 8
- Delta NACK = 8
- Delta CQI = 8
- Delta E-DPCCH = 6
5. Send TPC so that UE transmit power is 15 dBm
6. Wait 150 ms until the UE power becomes 15.0 dBm.
7. Do HSUPA Throughput measurement and confirm the E-TFCI measurement result is 92.
8. TPC_cmd = +1 and wait 150 ms.
9. Do HSUPA Throughput measurement and confirm the E-TFCI measurement result is 92
10. Repeat step 8 to 9 until the E-TFCI measurement result is not 92.
11. TPC_cmd = -1
12. Do HSUPA Throughput measurement and confirm the E-TFCI measurement result is 92 again.
13. TPC_cmd = -1 and wait 150 ms.
14. Do HSUPA Throughput measurement and confirm the E-TFCI measurement result is 92.
15. Repeat step 13 to 14 until the E-TFCI measurement result is not 92.
16. Measure the UE Tx power and check if it is +23dBm (Tolerance +2.7/–5.2 dB).
[Subtest4]
1. Set Delta CQI = 8
2. Set Absolute Grant = 17
3. Set E-TFCI As follows.
|
Number of E-TFCI = 5 |
|
|
|
|
E-TFCI = 11 |
E-TFCI PO = 4 |
|
|
E-TFCI = 67 |
E-TFCI PO = 18 |
|
|
E-TFCI = 71 |
E-TFCI PO = 23 |
|
|
E-TFCI = 75 |
E-TFCI PO = 26 |
|
|
E-TFCI = 81 |
E-TFCI PO = 27 |
4. Set Beta C, Beta D, Delta ACK, Delta NAC, Delta CQI, Delta E-DPCCH as follows. (Note : This is to meet 34.121 Table C 11.1.3 requirement. Delta ACK, Delta NAC, Delta CQI are set in such way that HS-DPCCH is being transmitted with a flat power)
- Beta C = 2
- Beta D = 15
- Delta ACK = 8
- Delta NACK = 8
- Delta CQI = 8
- Delta E-DPCCH = 5
5. Send TPC so that UE transmit power is 16 dBm and maintain the same power.
6. Wait 150 ms until the UE power becomes 14.0 dBm.
7. Do HSUPA Throughput measurement and confirm the E-TFCI measurement result is 71.
8. TPC_cmd = +1 and wait 150 ms.
9. Do HSUPA Throughput measurement and confirm the E-TFCI measurement result is 71
10. Repeat step 8 to 9 until the E-TFCI measurement result is not 71.
11. TPC_cmd = -1
12. Do HSUPA Throughput measurement and confirm the E-TFCI measurement result is 71 again.
13. TPC_cmd = -1 and wait 150 ms.
14. Do HSUPA Throughput measurement and confirm the E-TFCI measurement result is 71.
15. Repeat step 13 to 14 until the E-TFCI measurement result is not 71.
16. Measure the UE Tx power and check if it is +22dBm (Tolerance +3.7/–5.2 dB).
[Subtest5 –upto v8.7.0]
1. Set Delta CQI = 8
2. Set Absolute Grant = 21
3. Set E-TFCI As follows.
|
Number of E-TFCI = 5 |
|
|
|
|
E-TFCI = 11 |
E-TFCI PO = 4 |
|
|
E-TFCI = 67 |
E-TFCI PO = 18 |
|
|
E-TFCI = 71 |
E-TFCI PO = 23 |
|
|
E-TFCI = 75 |
E-TFCI PO = 26 |
|
|
E-TFCI = 81 |
E-TFCI PO = 27 |
4. Set Beta C, Beta D, Delta ACK, Delta NAC, Delta CQI, Delta E-DPCCH as follows. (Note : This is to meet 34.121 Table C 11.1.3 requirement. Delta ACK, Delta NAC, Delta CQI are set in such way that HS-DPCCH is being transmitted with a flat power)
- Beta C = 14
- Beta D = 15
- Delta ACK = 8
- Delta NACK = 8
- Delta CQI = 8
- Delta E-DPCCH = 7
5. Send TPC so that UE transmit power is 16 dBm and maintain the same power.
6. Wait 150 ms until the UE power becomes 16.0 dBm.
7. Do HSUPA Throughput measurement and confirm the E-TFCI measurement result is 81.
8. TPC_cmd = +1 and wait 150 ms.
9. Do HSUPA Throughput measurement and confirm the E-TFCI measurement result is 81
10. Repeat step 8 to 9 until the E-TFCI measurement result is not 81.
11. TPC_cmd = -1
12. Do HSUPA Throughput measurement and confirm the E-TFCI measurement result is 81 again.
13. TPC_cmd = -1 and wait 150 ms.
14. Do HSUPA Throughput measurement and confirm the E-TFCI measurement result is 81.
15. Repeat step 13 to 14 until the E-TFCI measurement result is not 81.
16. Measure the UE Tx power and check if it is +24dBm (Tolerance +1.7/–6.7 dB).
[Subtest5 –since v8.8.0]
1. Set Delta CQI = 8
2. Set Absolute Grant = 12
3. Set E-TFCI As follows.
|
Number of E-TFCI = 1 |
|
|
|
|
E-TFCI = 67 |
E-TFCI PO = 18 |
4. Set Beta C, Beta D, Delta ACK, Delta NAC, Delta CQI, Delta E-DPCCH as follows. (Note : This is to meet 34.121 Table C 11.1.3 requirement. Delta ACK, Delta NAC, Delta CQI are set in such way that HS-DPCCH is being transmitted with a flat power)
- Beta C = ?
- Beta D = ?
- Delta ACK = 0
- Delta NACK = 0
- Delta CQI = 0
- Delta E-DPCCH = 0
- minimum set of E-TFCI = 67
5. Send TPC so that UE transmit power is 16 dBm and maintain the same power.
6. Wait 150 ms until the UE power becomes 16.0 dBm.
7. Send TPC ALL 1 so that UE transmit power is its Max power.
8. Wait 150 ms until the UE power becomes its Max Power.
9. Measure the UE Tx power and check if it is +24dBm (Tolerance +1.7/–6.7 dB).
34.121-1 Table C.11.1.3 below is where the sub-test settings above come from. Each row fixes the beta values, the AG index and the E-TFCI that the UE should reach at maximum power. The CM and MPR columns explain why the expected power differs between sub-tests. A higher cubic metric lets the UE reduce its maximum power by the MPR, and the table gives the MPR for each sub-test.
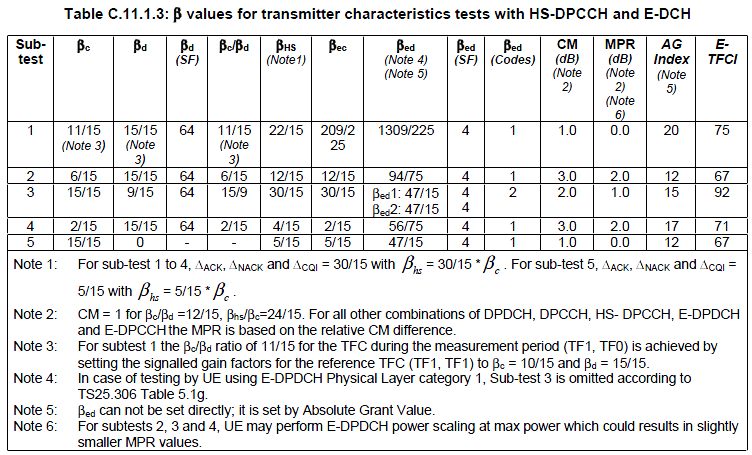
Sub-test 1 and 5 : MPR 0.0 dB, so the test power is +24 dBm for a Power Class 3 UE.Sub-test 3 : CM 2.0 dB and MPR 1.0 dB, so the test power is +23 dBm.Sub-test 2 and 4 : CM 3.0 dB and MPR 2.0 dB, so the test power is +22 dBm.E-TFCI : the value in the last column is the one that the SS expects at the end of the TPC up and down steps.
Two values in the procedure above need a check against the current release. In 34.121-1 v16.2.0, Table C.11.1.3 gives AG index 20 for sub-test 1 and 12 for sub-test 2, as the image shows. Table 5.2B.5 of the same version gives a sub-test 5 tolerance of +1.7/-3.7 dB, which is tighter than the value in the sub-test 5 steps.
The UE must lower its E-TFCI rather than exceed its maximum power : the SS pushes the UE up with TPC commands until the E-TFCI drops.The power is measured one step below that point : there the UE sends the target E-TFCI at its full allowed power.The expected power depends on the MPR : +24, +23 or +22 dBm for a Power Class 3 UE, depending on the sub-test.
5.2C UE Relative Code Domain Power Accuracy - Release 6 and later
Even when total UE TX power stay constant, each component physical channel power should vary dynamically depending on the channel composition. The component of Uplink transmission signal with HSDPA environment are as follows :
- U DPCCH
- U DPDCH
- HS-DPCCH
Once connection is made, U DPCCH + U DPDCH is always being transmitted, but HS-DPCCH transmission varies depending on configuration. For example, when there is no HS-DPCCH being transmitted, DPCCH + DPDCH power would increase to fill the power space where HS-DPCCH used to take up and when there is HS-DPCCH being transmitted, DPCCH + DPDCH power would decrease to make enough space for the HS-DPCCH to fill in.
Even when the composition of Uplink power is same, the portions of the power for each channel can vary with the following configuration.
- Beta C
- Beta D
- Delta ACK
- Delta NACK
- Delta CQI
- CQI Feedback Cycle
- ACK/NACK Repetition Factor
- CQI Repetition Factor
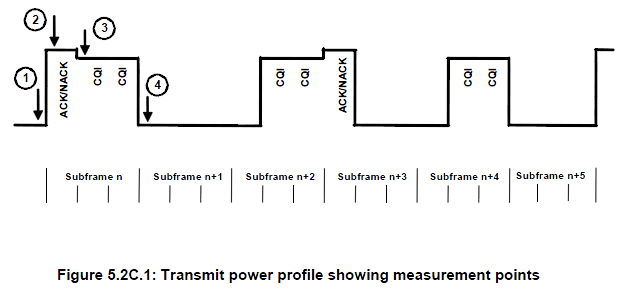
Depending on the factors described above, uplink power profile in the time domain may look as follows. This test cases measures each of the channel power at the following four points depending on each subtest configuration. (The point labeled (1), (2), (3), (4) is the point where the power is measured).
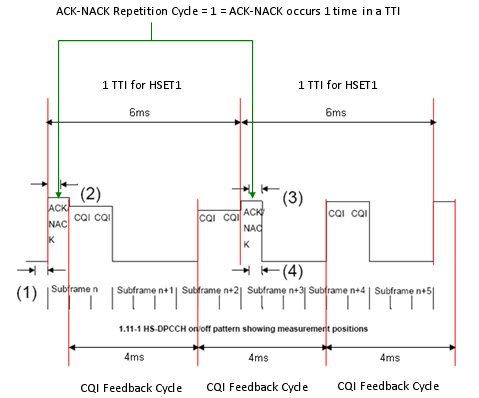
The reason why the Transmit Power Profile become like this can be illustrated as follows.
Following is the measurement result for each subtest. Each bar represents the relative power for each component channels (DPCCH, DPDCH, HS-DPCCH)
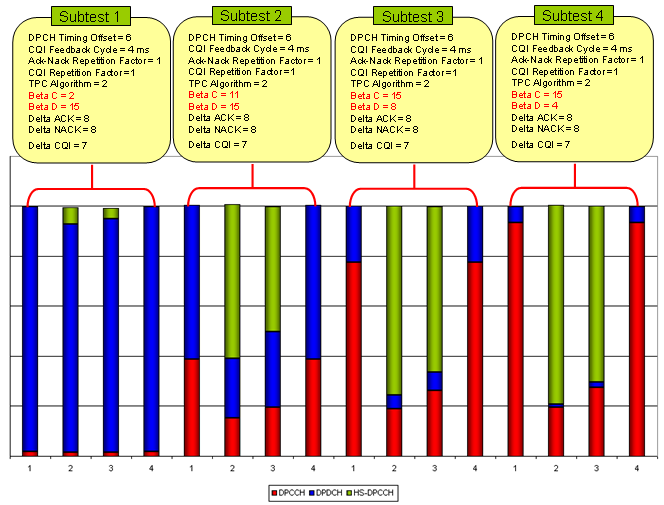
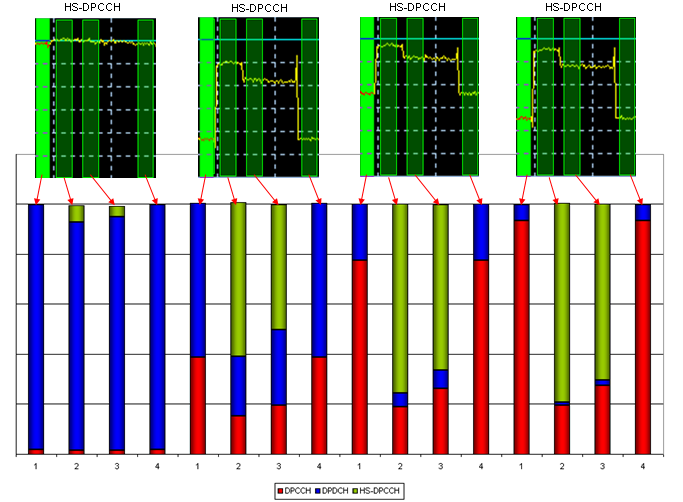
The pass criterion is the UE Relative CDP accuracy. It is the measured CDP ratio of a code minus its nominal CDP ratio, where each ratio is the code power relative to the total power of all active codes. 25.101 Table 6.1B allows +/-1.5 dB for a code at -10 dB or more of the total. The tolerance widens as the code gets weaker, up to +/-3.0 dB between -20 dB and -30 dB. So a small bar in the charts above, such as the DPCCH in sub-test 1, gets a looser tolerance than a large one.
The measurement points follow Figure 5.2C.1 above. The UE sends a pattern that repeats every 12 ms, and the SS measures over half a slot at each point. Point 1 is the half slot before the ACK/NACK, point 2 is the first half slot of the ACK/NACK, point 3 is the first half slot of the CQI, and point 4 is the first half slot after the CQI. The beta values in the chart come from 34.121-1 Table C.10.1.4. The chart shows 11/15 for sub-test 2 because that is the signalled value, while the table gives the resulting ratio of 12/15.
The total power stays the same : only the split between DPCCH, DPDCH and HS-DPCCH changes from point to point.Each code is judged against its own nominal ratio : a weak code gets up to +/-3.0 dB, a strong one +/-1.5 dB.The test applies to a UE with HSDPA but without E-DCH : a UE with E-DCH is tested for code domain power accuracy in 5.2D.
5.4.1 Open Loop Power Control in the Uplink
Open loop power control sets the power of the first PRACH preamble, before the UE has received any TPC command. The UE estimates the path loss from the CPICH RSCP it measures and the Primary CPICH DL TX power in system information. It then adds the UL interference and the Constant Value from system information. This test checks that the first preamble arrives within +/-9 dB of the expected power in normal conditions, and within +/-12 dB in extreme conditions.
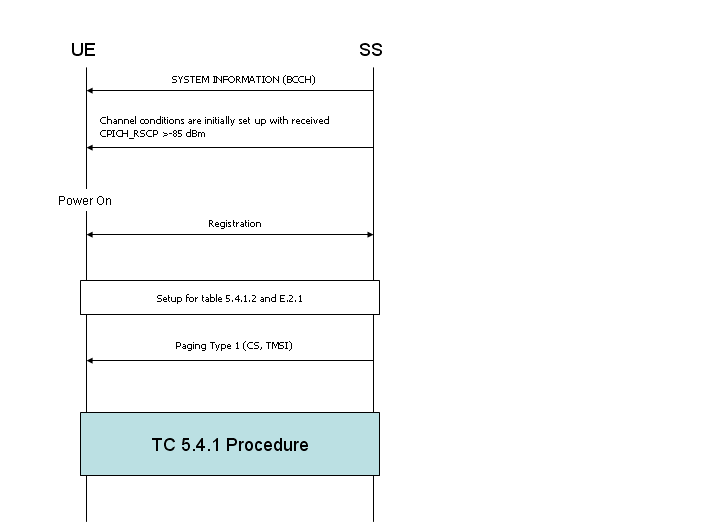
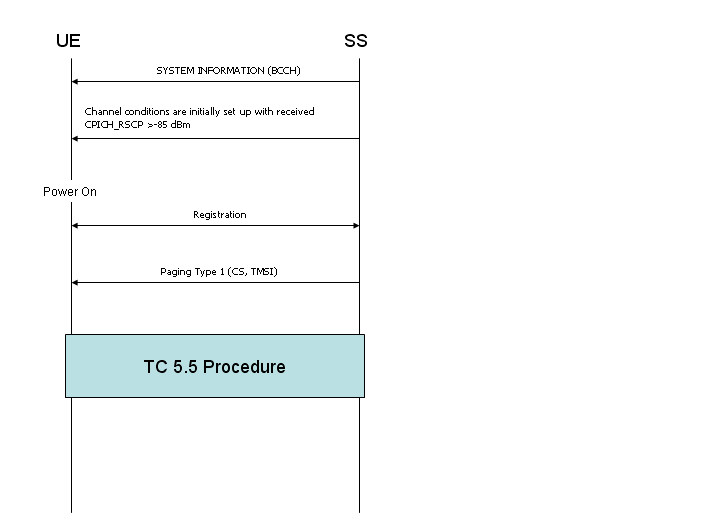
The diagram below is the preparation. The SS sets up the cell with a CPICH_RSCP above -85 dBm, the UE powers on and registers, and the SS then pages the UE.
The diagram below is the measurement. The SS sets the downlink level according to 34.121-1 Table 5.4.1.3, and the UE answers the paging with a RACH preamble. The SS measures the mean power of that first preamble, which the diagram calls the ON power. In the table the first level is -25 dBm / 3.84 MHz, and the minus sign is missing from the drawing.
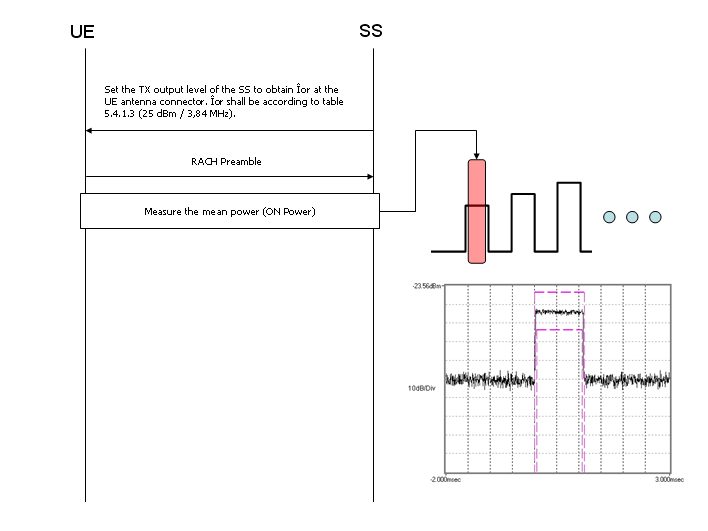
The expected power is simple to calculate. At the first level of Table 5.4.1.3, the Primary CPICH DL TX power is +19 dBm and the CPICH_RSCP is -28.9 dBm, so the path loss is 47.9 dB. The UL interference is -75 dBm and the Constant Value is -10 dB. So the expected UE power is -75 + 47.9 - 10 = -37.1 dBm. The test requirement adds the test tolerance, so the SS accepts +/-10 dB in normal conditions and +/-13 dB in extreme conditions.
Only the first preamble is measured : later preambles are raised by the power ramp step and no longer show the open loop estimate.The test is repeated at three downlink levels : the upper dynamic end, the middle and the sensitivity level, so the receiver has to measure CPICH correctly over its whole range.The tolerance is wide : +/-9 dB in the minimum requirement, because the estimate depends on the RSCP measurement accuracy.
5.5 Transmit ON/OFF Power
A UE that is not transmitting still leaks some power into the uplink. 25.101 requires this transmit OFF power to be less than -56 dBm. The test also checks the power of the first PRACH preamble, so it measures both sides of the ON/OFF switching in one run.
The diagram below is the same preparation as in 5.4.1: system information, registration and paging.
In the diagram below, the SS sets the downlink level and the test parameters of 34.121-1 Table 5.5.2.3 for the power class of the UE. It measures the ON power on the first RACH preamble, shown in red. It then measures the OFF power before and after a preamble, shown in blue. The two traces on the right are the ON power and the OFF power measurements.
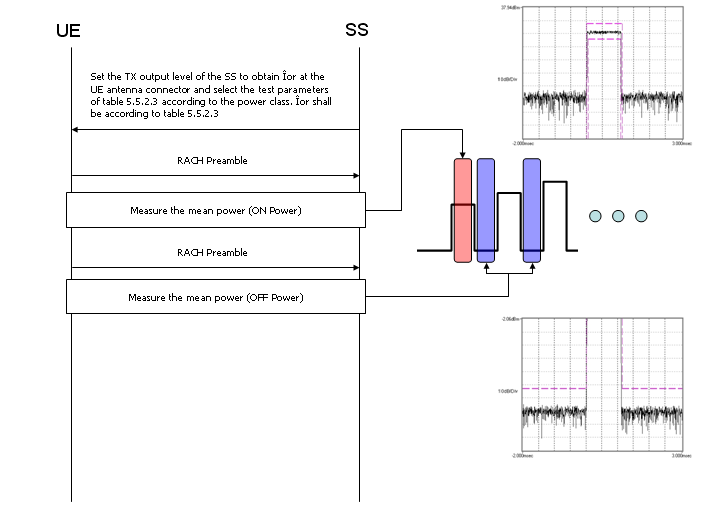
The OFF power is the RRC filtered mean power over 2368 chips. The SS leaves out a 25 microsecond transient period, that is 96 chips, next to the preamble. The ON and OFF levels are far apart, so the SS may measure the OFF power on a later preamble rather than on the first one.
The OFF power limit for the test is -55 dBm : the -56 dBm minimum requirement plus the test tolerance.The ON power must meet the open loop tolerance : the lower limit comes from 5.4.1 and the upper limit from the maximum output power test.The transient periods are not measured : 25 microseconds on each side of the preamble belong to neither state.
5.6 Change of TFC
When the TFC changes, the data rate changes, and the UE changes its total power by changing the DPDCH to DPCCH amplitude ratio. The DPCCH power itself must keep following inner loop power control. This test uses the simplest case, DTX, where the DPDCH is switched off and on while the DPCCH stays on.
The two diagrams below set up the call. The UE is brought into RB test mode, a radio bearer is set up, and the UE test loop is closed so that the UE transmits the DPDCH.
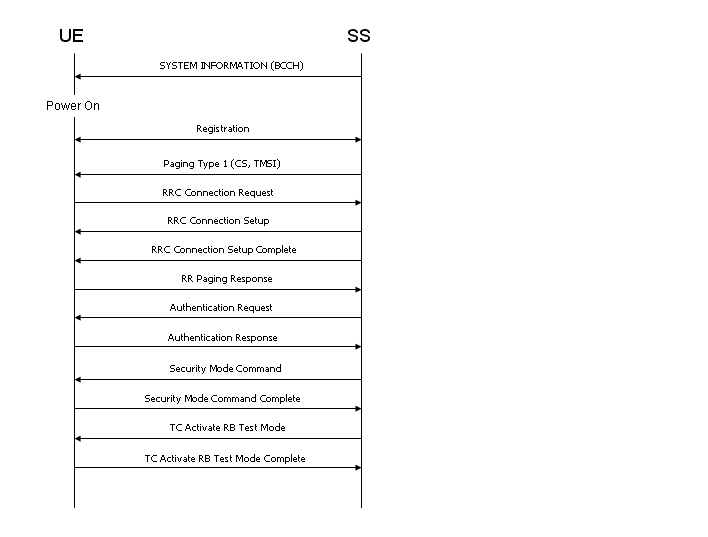
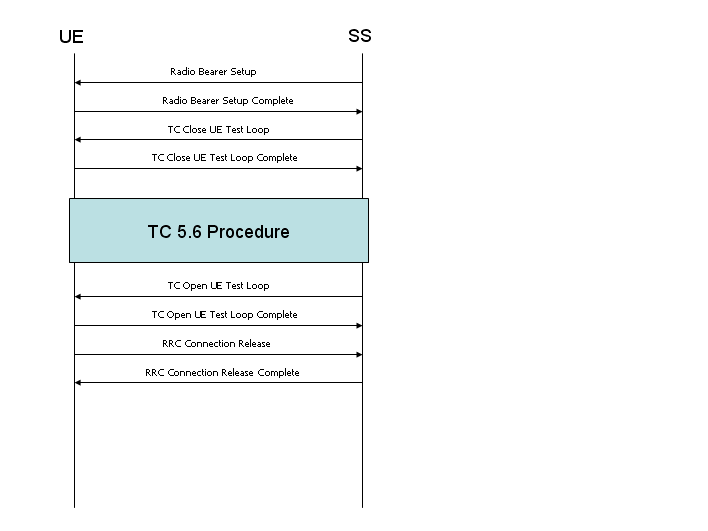
The diagram below is the measurement. The SS sets the UE power to 0 dBm +/-1 dB and sends alternating TPC bits, so that TPC_cmd = 0 and the DPCCH power stays constant. It then measures the mean power with DPDCH on, with DPDCH off, and with DPDCH on again.
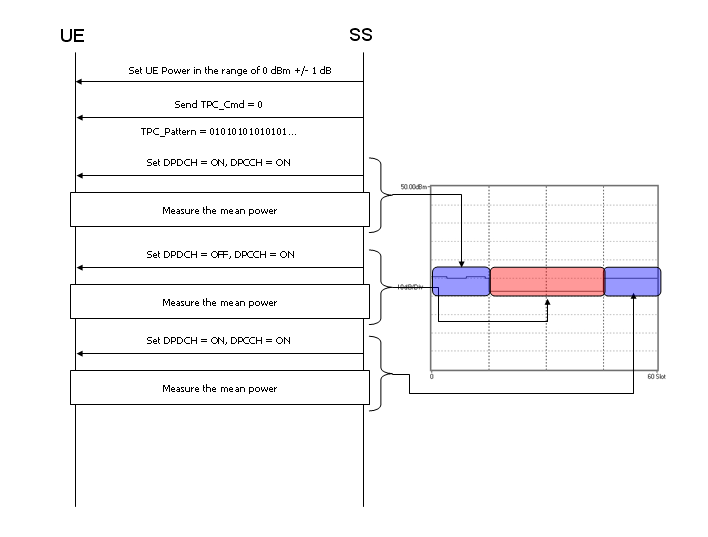
The expected step follows from the beta values. With βc = 0.5333 and βd = 1.0, the total power drops by 10 log10((βc2 + βd2) / βc2), which is about 6.5 dB. The UE rounds the step to the closest integer dB, so the nominal step is 7 dB. 34.121-1 Table 5.6.3 allows +/-2.3 dB around it.
TPC_cmd = 0 keeps the DPCCH still : any step the SS measures then comes from the DPDCH alone.The step is rounded to whole dB : 25.101 Table 6.8 gives the tolerance for each step size, from +/-0.5 dB for a step of 0 or 1 dB to +/-6.0 dB for a step of 21 dB or more.Transient periods are excluded : the mean power is measured away from the slot boundary where the power changes.
5.7 Power setting in uplink compressed mode
In an uplink compressed frame, the UE sends the same data in fewer slots, so it has to change its power. The pilot energy per slot must still follow inner loop power control, and the number of pilot bits per slot can change. After a transmission gap, the UE also has to resume at the right power. This test checks all three.
The two diagrams below set up the call in the same way as in 5.6.
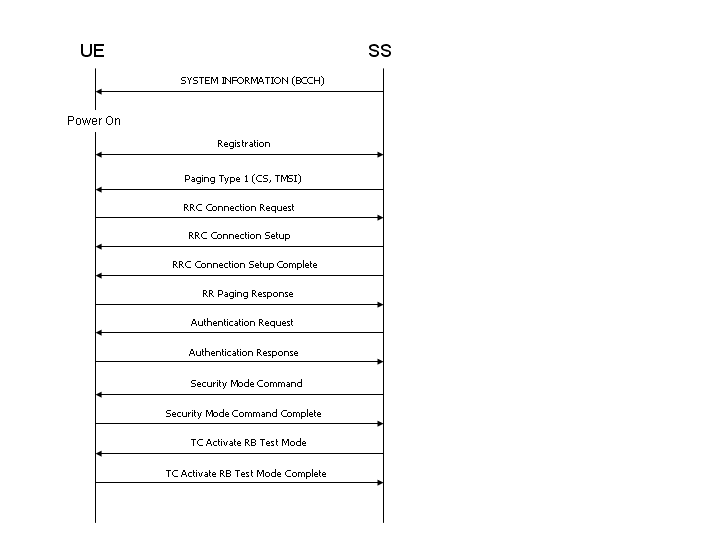
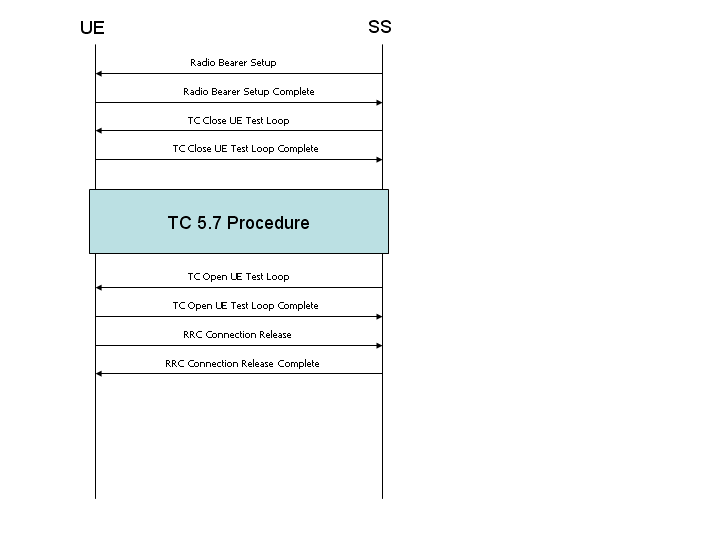
The two diagrams below are the measurement. The SS first sets the UE power to -36 +/-9 dBm and sends a Physical Channel Reconfiguration with power control Algorithm 1, a 2 dB step and the compressed mode pattern of 34.121-1 Table 5.7.5. It measures the mean power in the listed slots around the gaps. The SS then repeats the measurement at a higher power, with a TPC pattern that drives the power down and up around the gaps.
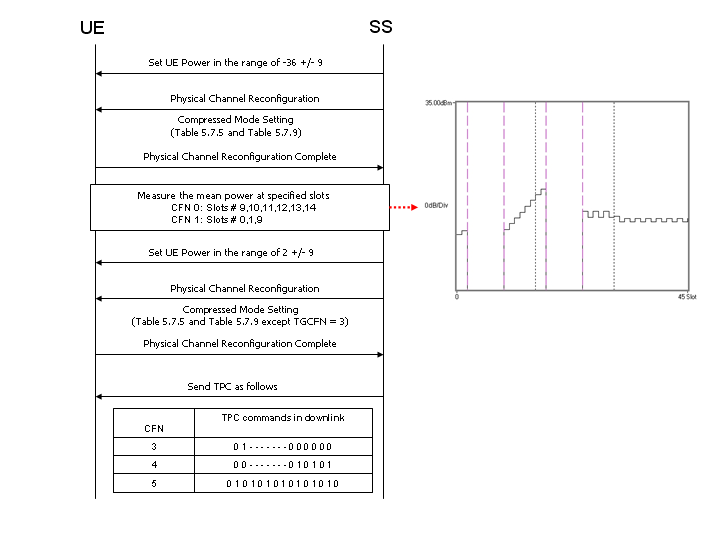
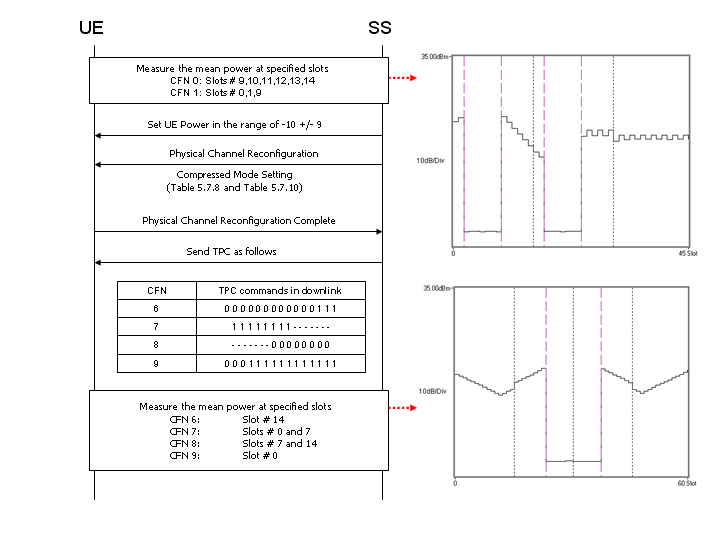
Two effects add up in each step. The first is the inner loop step. The second is 10 log10(Npilot.prev / Npilot.curr) dB, because the pilot energy per slot must stay on target when the number of pilot bits changes. After the gap, the UE resumes with an extra power difference, ΔRESUME, which 25.214 clause 5.1.2.3 defines.
Compressed mode raises the power : the same data goes into fewer slots, so the DPDCH needs a higher amplitude.The pilot bit count changes the step : the extra step is 10 log10(Npilot.prev / Npilot.curr) dB.The resume power is checked too : 25.101 Table 6.9 allows +/-3 dB or more after a gap of up to 14 slots, depending on the size of the difference.
5.7A HS-DPCCH Power Control
The transmission of Ack/Nack or CQI over the HS-DPCCH may cause the transmission power in the uplink to vary and the ratio of the amplitude between the DPCCH and the Ack/Nack and CQI respectively is signalled by higher layers
The nominal sum power on DPCCH+DPDCH is independent of the transmission of Ack/Nack and CQI, but if UE output power with HS-DPCCH(Ack/Nack or CQI) exceed the specified maximum value or it fall below the specified value, UE may apply additional scaling to the total transmit power as defined in transmission power requirement. As a result, the overal power profile when both DPCCH+DPDCH and HS-DPCCH are transmitted simultaneously can be very complicated as shown below.
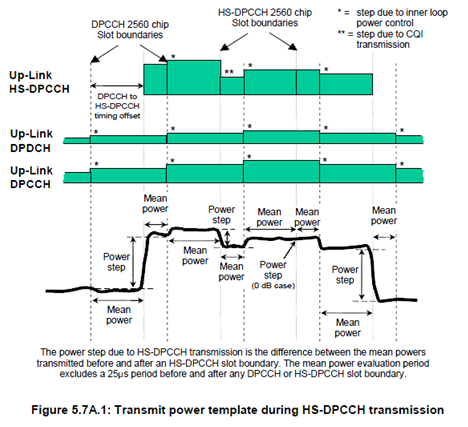
This test is to verify that the changes in uplink transmit power when transmitting the HS-DPCCH (Ack/Nack and CQI) and the power between HS-DPCCH transmissions are within the allowed power step tolerances as specified.
To test this, this test case configure HS-DPCCH transmission pattern as follows.
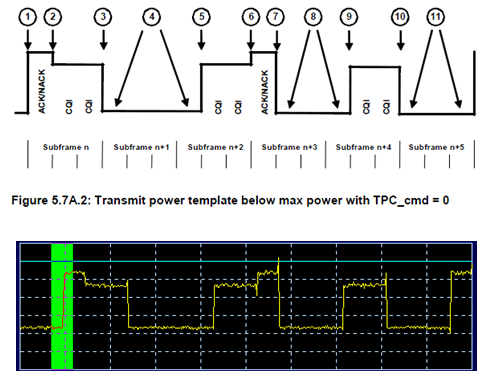
As the first step, SS set TPC_cmd = 0 (no power up, nor power down of UL DPCCH) and measure the power changes at the points as shown below.
At the second step, SS send TPC_cmd = 1 and check the power steps at the points marked as below.
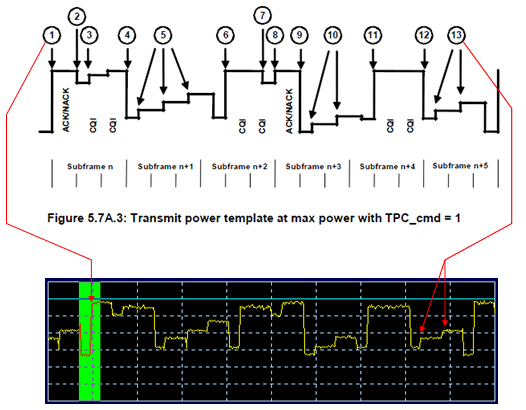
The two figures above differ in one thing. In Figure 5.7A.2 the DPCCH power is constant, so every power step comes from the HS-DPCCH switching on and off. In Figure 5.7A.3 the TPC commands push the UE up to its maximum power. There the UE may scale the total power, so the steps at the marked points may be smaller than their nominal value. Each measurement uses the mean power over half a slot and leaves out 25 microseconds at each slot boundary.
HS-DPCCH slots are not aligned with DPCCH slots : so the power can step at both slot boundaries, as Figure 5.7A.1 shows.The sum power of DPCCH and DPDCH should not change : the HS-DPCCH adds power on top of it, unless the UE reaches its maximum power.The test uses a 12 ms pattern : the beta values of 34.121-1 Table C.10.1.4 sub-test 3 and H-Set 1 give a repeating ACK/NACK and CQI sequence.
Reference
[1] 3GPP TS 34.121-1 v16.2.0 - clause 5.2B, 5.2C, 5.4.1, 5.5, 5.6, 5.7 and 5.7A, and Annex C.10 and C.11
[2] 3GPP TS 25.101 v19.0.0 - clause 6.2.3, 6.4.1, 6.5 and Annex A.7