Matlab Toolbox - 5G/NR
CSI-RS
NOTE : It is required to have Matlab 5G Toolbox to run this script. Matlab Version that I used for this page is 5G Toolbox Version 2.1 (R2020b)
- p8
- p16
- p32
| CSI_RS.m |
|
% NOTE : This code is based on the example in the Matlab document linked here. I modified the plotGrid() function for the visualization shown in this note.
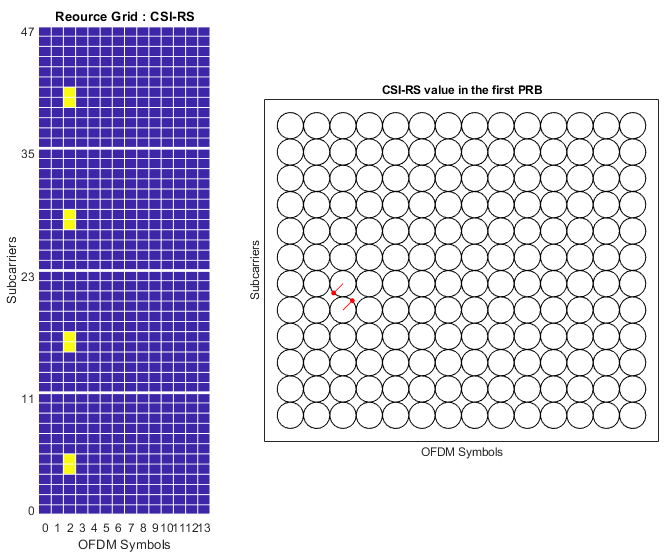
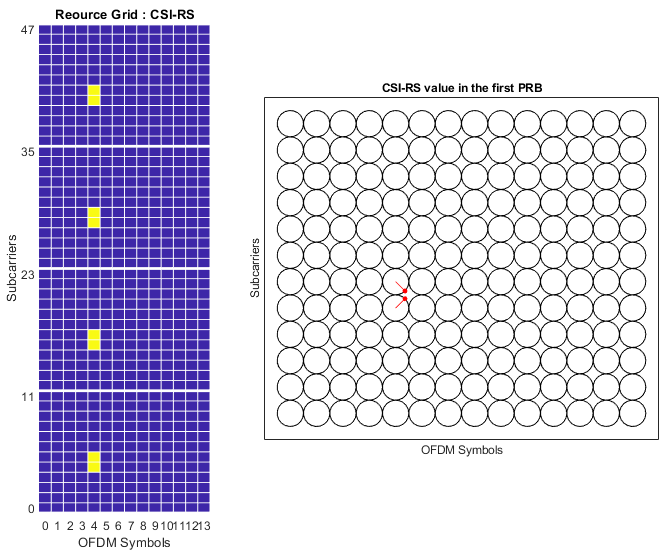
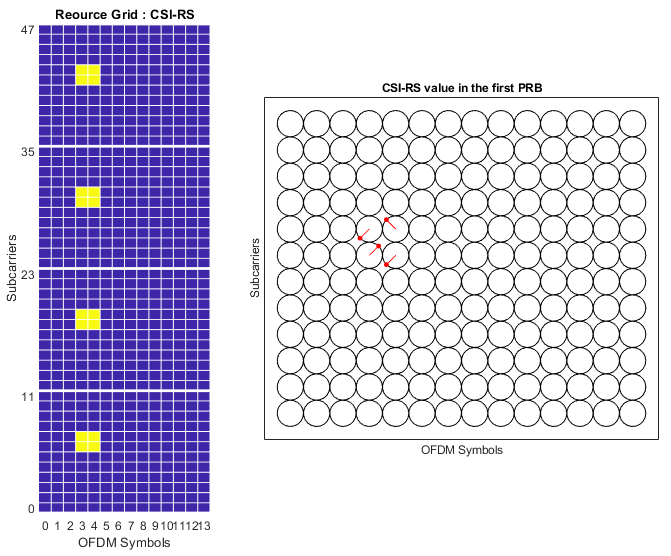
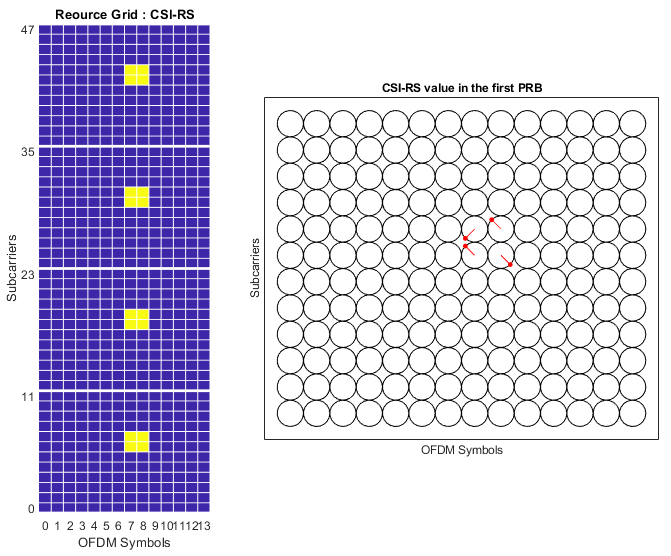
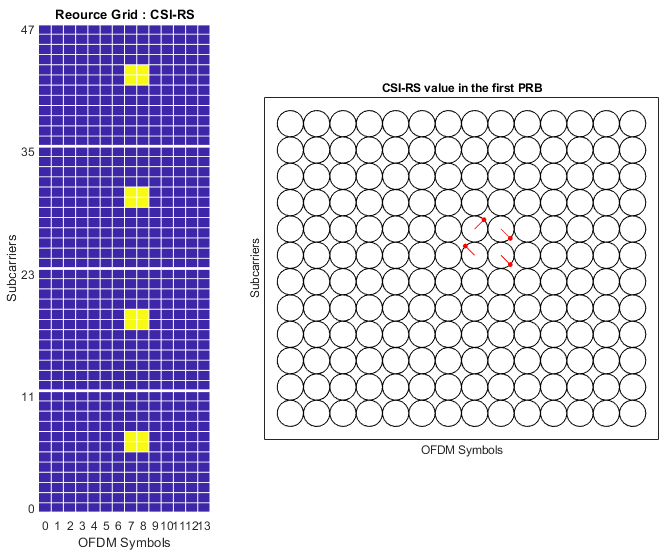
carrier = nrCarrierConfig; carrier.NSizeGrid = 4; carrier.SubcarrierSpacing = 15; carrier.NSlot = 1; carrier.NFrame = 0;
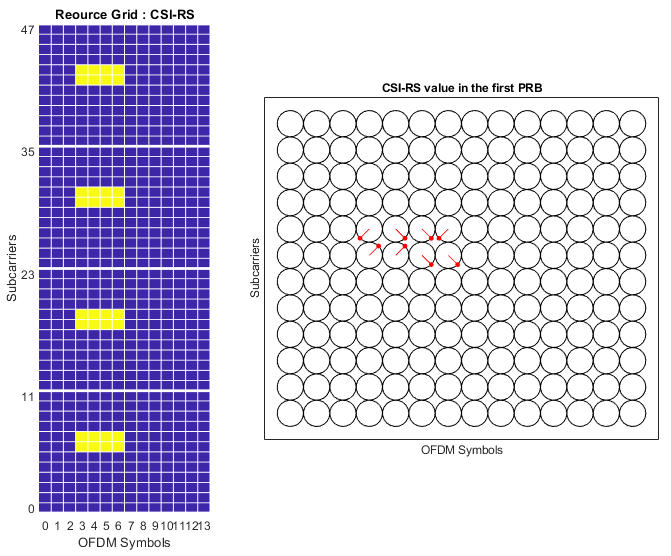
csirs = nrCSIRSConfig; csirs.CSIRSType = {'nzp'}; csirs.CSIRSPeriod = {[40 1]}; csirs.Density = {'three'}; csirs.RowNumber = [1]; csirs.SymbolLocations = {4}; csirs.SubcarrierLocations = {0}; csirs.NumRB = 4; csirs.NID = 2;
powerCSIRS = 0; sym = nrCSIRS(carrier,csirs); csirsSym = sym*db2mag(powerCSIRS);
csirsInd = nrCSIRSIndices(carrier,csirs);
ports = max(csirs.NumCSIRSPorts); % Number of antenna ports txGrid = nrResourceGrid(carrier,ports);
txGrid(csirsInd) = csirsSym;
RelativePortNo = 0; % 3000+RelativePortNo corresponds to p in TS 38.211 section 7.4.1.5.3 plotGrid(size(txGrid),csirsInd,csirsSym,RelativePortNo+1,ports);
function plotGrid(gridSize,csirsInd,csirsSym,gridIndex,NoOfPort)
figure() cmap = colormap(gcf); chpval = {20,2}; chpscale = 0.25*length(cmap); % Scaling factor
tempSym = csirsSym; tempSym(tempSym ~= 0) = chpval{1}; % Replacing non-zero-power symbols tempSym(tempSym == 0) = chpval{2}; % Replacing zero-power symbols tempGrid = complex(zeros(gridSize)); tempGrid(csirsInd) = tempSym; NoOfRsPerPort = length(csirsSym)/NoOfPort;
subplot(1,3,1); hold on; image(chpscale*tempGrid(:,:,gridIndex)); % Multiplied with scaling factor for better visualization axis xy; xlim([0.5 14.5]); set(gca,'xtick',1:14); set(gca,'xticklabel',{'0','1','2','3','4','5','6','7','8','9','10','11','12','13'}); ylim([0.5 48.5]); set(gca,'ytick',[0 11 23 35 47]+1); set(gca,'yticklabel',{'0','11','23','35','47'});
x = 1.5:1:14.5; y = 1.5:1:48.5; plot([x(:),x(:)],[0,48.5],'w-'); plot([0,14.5],[y(:),y(:)],'w-'); y = 0.5:12:48.5; plot([0,14.5],[y(:),y(:)],'w-','LineWidth',2);
%grid(); names = {'NZP CSI-RS','ZP CSI-RS'}; clevels = chpscale*[chpval{:}]; N = length(clevels); L = line(ones(N),ones(N),'LineWidth',8); % Generate lines % Index the color map and associate the selected colors with the lines set(L,{'color'},mat2cell(cmap( min(1+clevels,length(cmap) ),:),ones(1,N),3)); % Set the colors according to cmap % Create legend %legend(names{:});
title('Reource Grid : CSI-RS') xlabel('OFDM Symbols'); ylabel('Subcarriers');
subplot(1,3,[2 3]);
hold on;
for y = 1:12 for x = 1:14 circle(x,y,0.5); end end
symEnd = (gridIndex-1)*48*14 + 48; symIndexStart = (gridIndex-1)*NoOfRsPerPort+1; symIndexEnd = symIndexStart + NoOfRsPerPort-1; RePerGrid = 48*14; for i = symIndexStart:symIndexEnd vx1 = double(floor((csirsInd(i)-RePerGrid*(gridIndex-1))/48)+1); vy1 = double(mod(csirsInd(i),48)); vx2 = vx1 + 0.5*real(csirsSym(i)); vy2 = vy1 + 0.5*imag(csirsSym(i)); if vy1 < 13 line([vx1 vx2],[vy1 vy2],'Color','red'); plot(vx2,vy2,'ro','MarkerFaceColor',[1 0 0],'MarkerSize',3); end tmpStr = sprintf("%d,%f,%f",csirsInd(i),vx1,vy1); disp(tmpStr); end axis([0 15 0 13]); set(gca,'xticklabel',[]);set(gca,'yticklabel',[]); set(gca,'xtick',[]);set(gca,'ytick',[]); set(gca,'fontsize',8); daspect([1 1 1]); box on; title('CSI-RS value in the first PRB') xlabel('OFDM Symbols'); ylabel('Subcarriers')
set(gcf, 'Position', [100 100 800 600]); set(gcf,'color','w'); end
function circle(x,y,r) t = linspace(0,2*pi,20); plot(x+r*cos(t),y+r*sin(t),'k-'); end
|
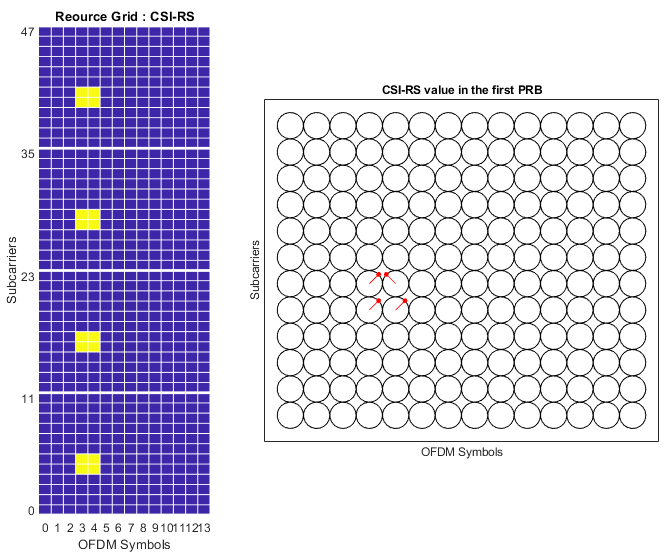
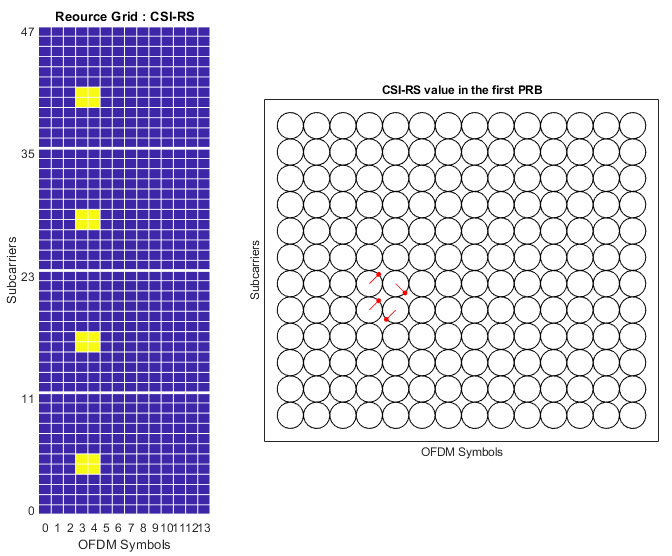
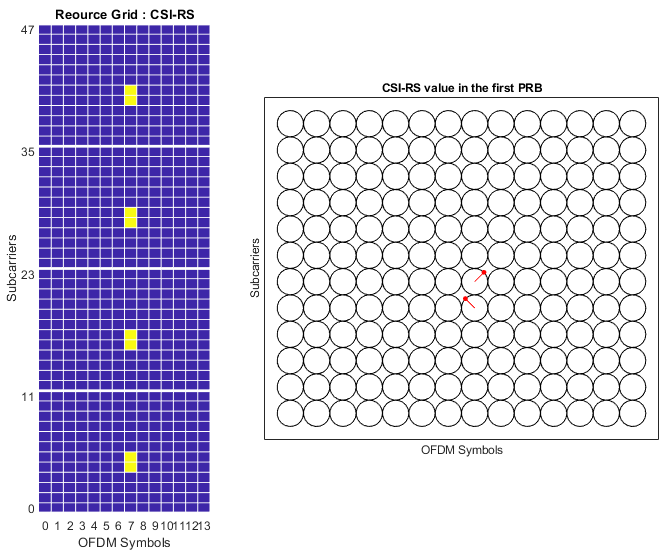
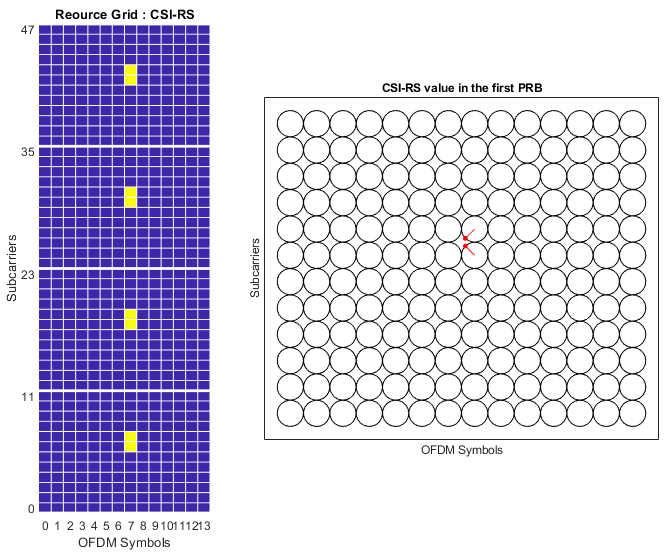
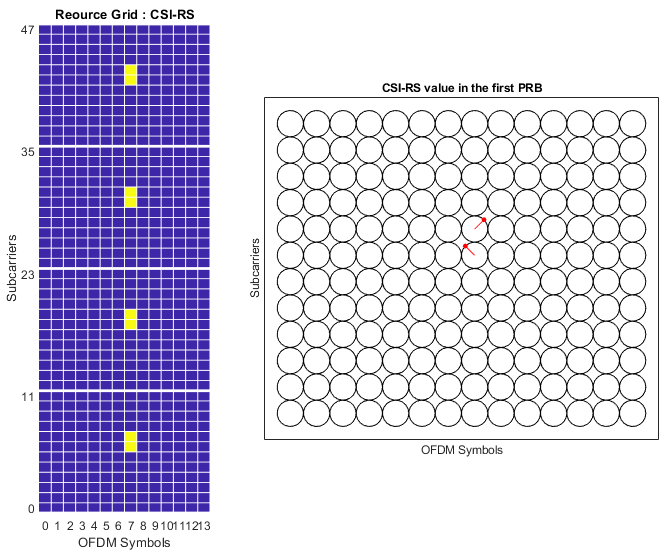
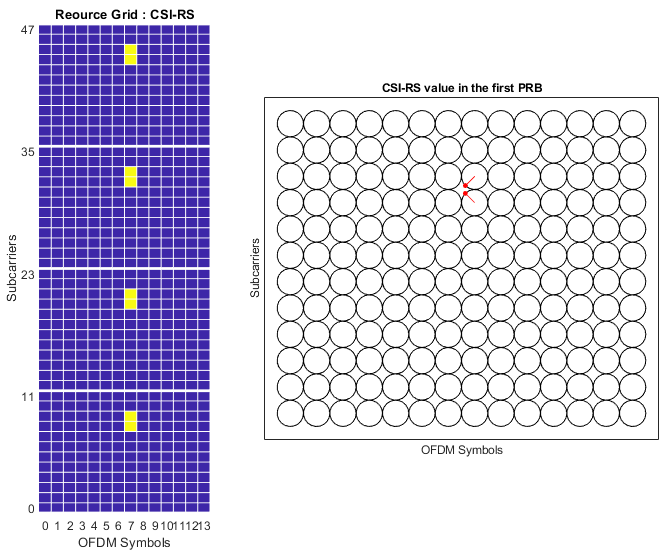
Example for 8 ports CSI-RS
|
Example 01> Row 6. This example is to visualize the CSI-RS for each antenna port described in this note. NOTE : The result of this case in SlideShow mode is posted here. |
|
csirs = nrCSIRSConfig; csirs.CSIRSType = {'nzp'}; csirs.CSIRSPeriod = {[40 1]}; csirs.Density = {'one'}; csirs.RowNumber = [6]; csirs.SymbolLocations = {3}; csirs.SubcarrierLocations = {[2 4 6 8]}; csirs.NumRB = 4; csirs.NID = 0; |
|
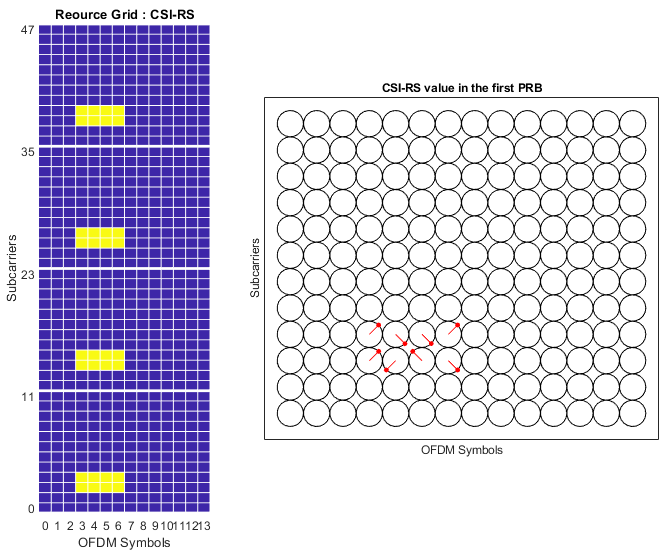
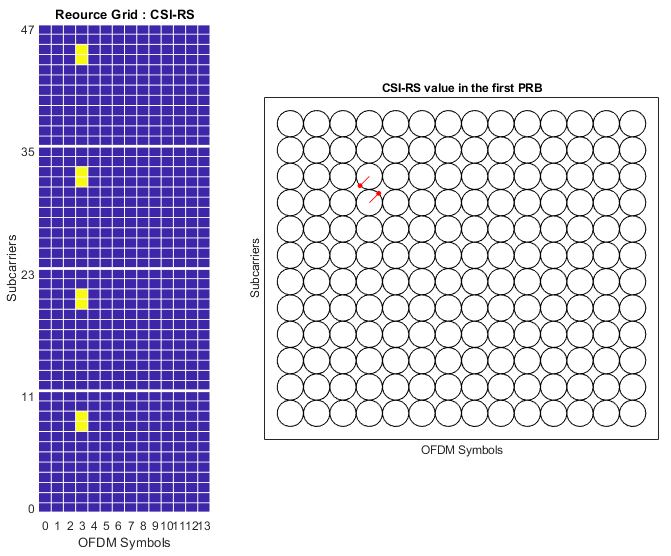
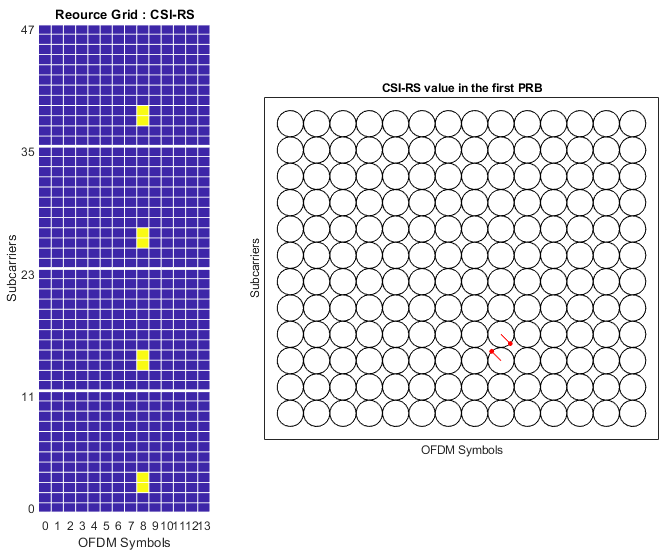
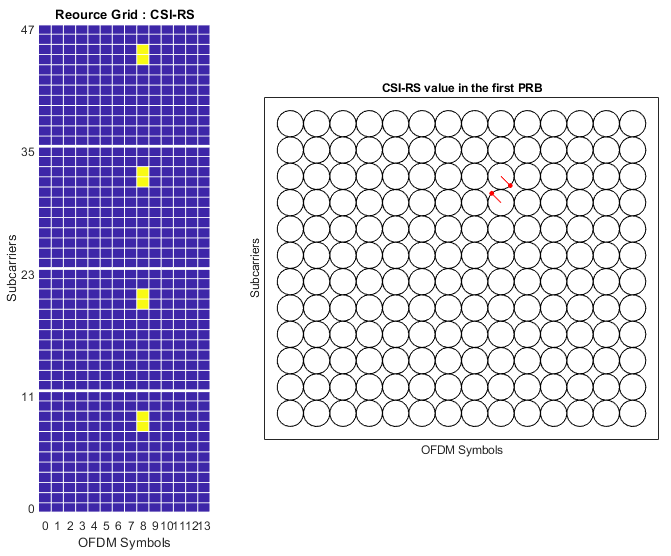
1st Port :
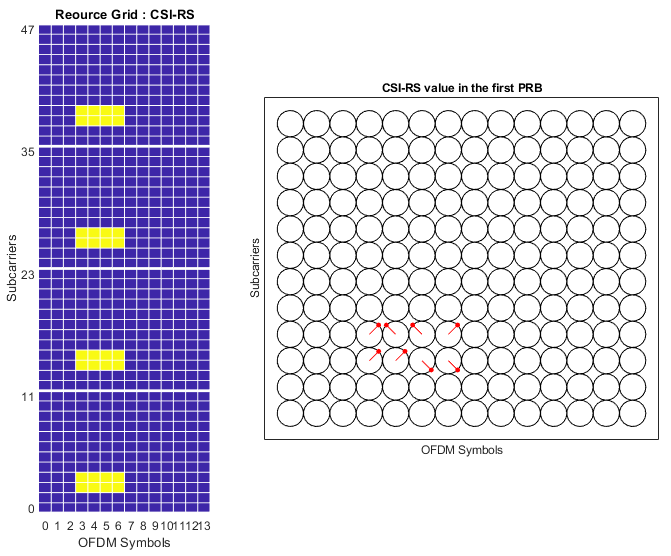
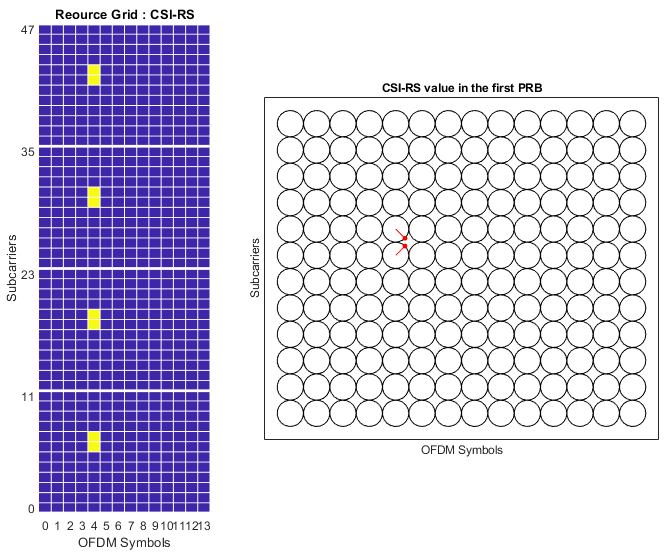
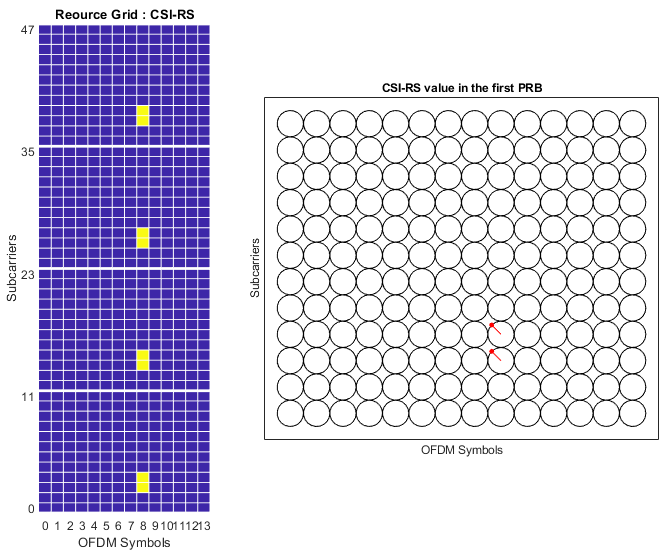
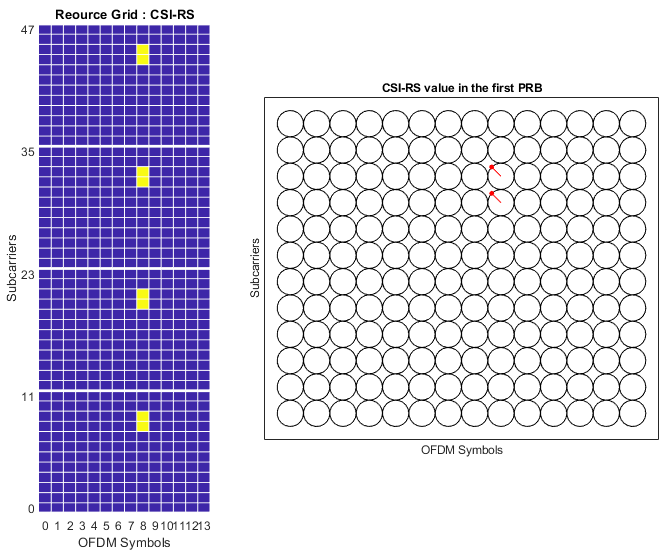
2nd Port :
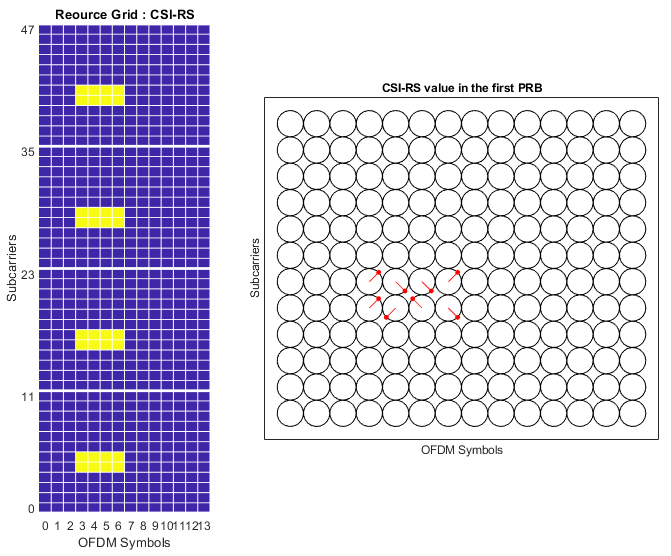
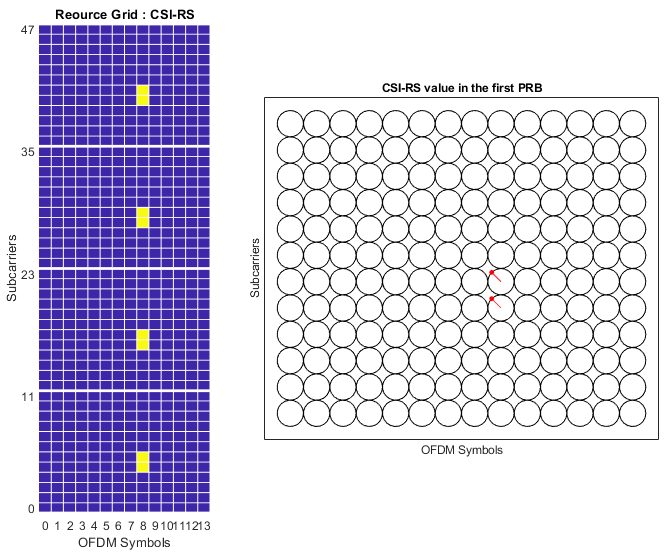
3rd Port :
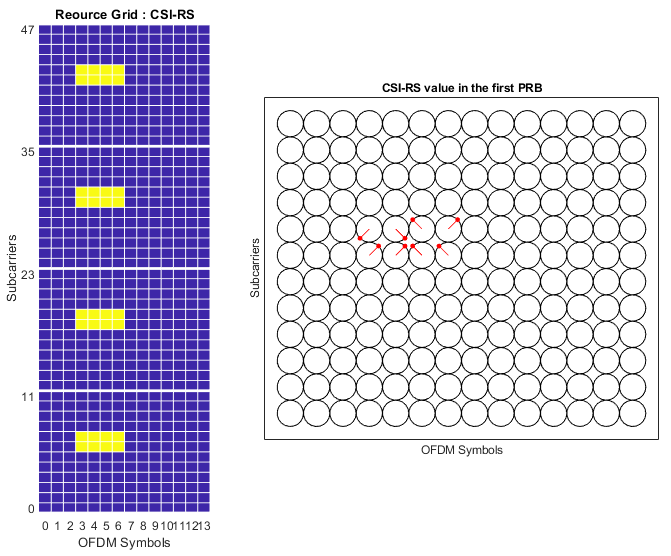
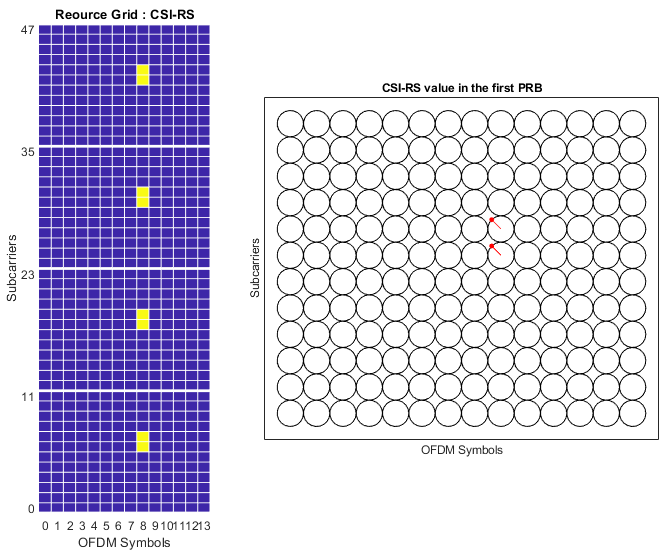
4th Port :
5th Port :
6th Port :
7th Port :
8th Port :
|


|
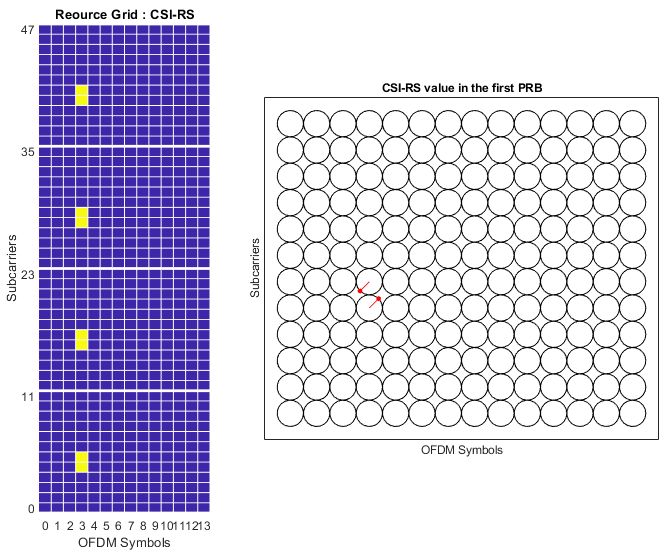
Example 02> Row 7. This example is to visualize the CSI-RS for each antenna port described in this note. NOTE : The result of this case in SlideShow mode is posted here. |
|
csirs = nrCSIRSConfig; csirs.CSIRSType = {'nzp'}; csirs.CSIRSPeriod = {[40 1]}; csirs.Density = {'one'}; csirs.RowNumber = [7]; csirs.SymbolLocations = {2}; csirs.SubcarrierLocations = {[2 4]}; csirs.NumRB = 4; csirs.NID = 0; |
|
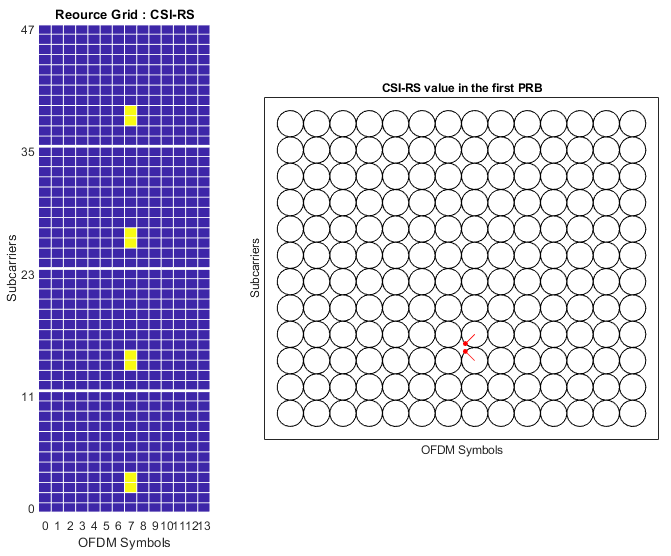
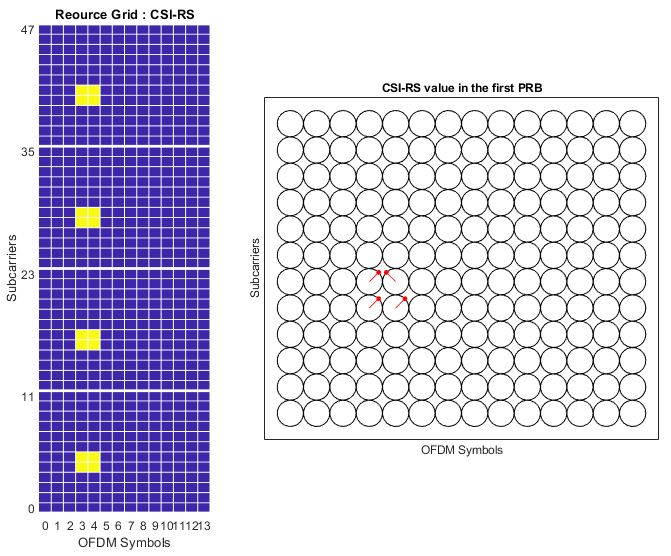
1st Port :
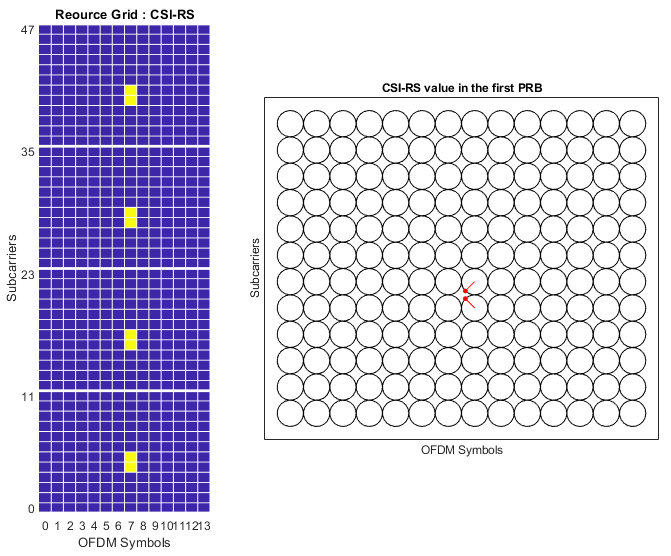
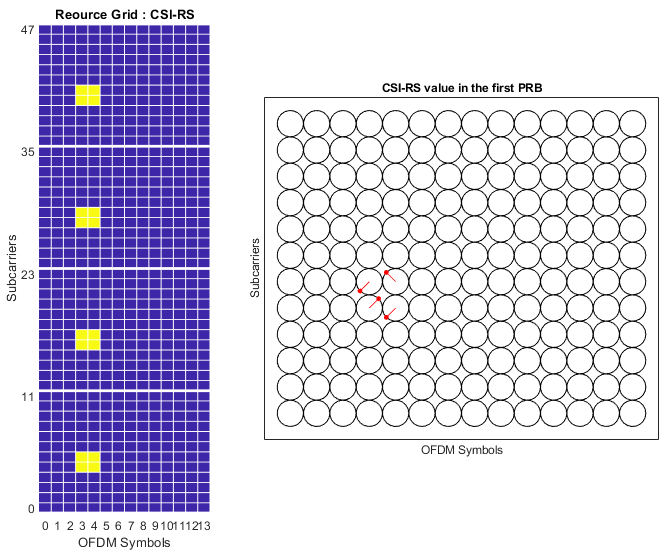
2nd Port :
3rd Port :
4th Port :
5th Port :
6th Port :
7th Port :
8th Port :
|


|
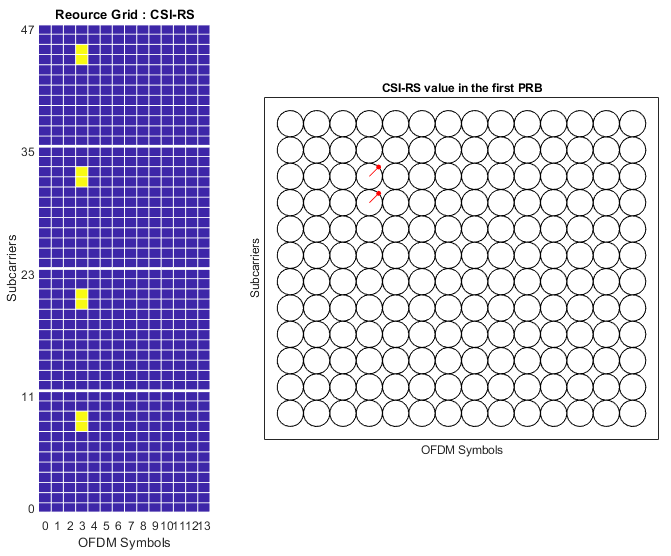
Example 03> Row 8. This example is to visualize the CSI-RS for each antenna port described in this note. NOTE : The result of this case in SlideShow mode is posted here. |
|
csirs = nrCSIRSConfig; csirs.CSIRSType = {'nzp'}; csirs.CSIRSPeriod = {[40 1]}; csirs.Density = {'one'}; csirs.RowNumber = [8]; csirs.SymbolLocations = {3}; csirs.SubcarrierLocations = {[2 4]}; csirs.NumRB = 4; csirs.NID = 0; |
|
1st Port :
2nd Port :
3rd Port :
4th Port :
5th Port :
6th Port :
7th Port :
8th Port :
|


|
Example 01> Row 11. NOTE : The result of this case in SlideShow mode is posted here. |
|
csirs = nrCSIRSConfig; csirs.CSIRSType = {'nzp'}; csirs.CSIRSPeriod = {[40 1]}; csirs.Density = {'one'}; csirs.RowNumber = [11]; csirs.SymbolLocations = {3}; csirs.SubcarrierLocations = {[2 4 6 8]}; csirs.NumRB = 4; csirs.NID = 0; |
|
1st Port :
2nd Port :
3rd Port :
4th Port :
5th Port :
6th Port :
7th Port :
8th Port :
9th Port :
10th Port :
11th Port :
12th Port :
13th Port :
14th Port :
15th Port :
16th Port :
|


|
Example 02> Row 12. NOTE : The result of this case in SlideShow mode is posted here. |
|
csirs = nrCSIRSConfig; csirs.CSIRSType = {'nzp'}; csirs.CSIRSPeriod = {[40 1]}; csirs.Density = {'one'}; csirs.RowNumber = [12]; csirs.SymbolLocations = {3}; csirs.SubcarrierLocations = {[2 4 6 8]}; csirs.NumRB = 4; csirs.NID = 0; |
|
1st Port :
2nd Port :
3rd Port :
4th Port :
5th Port :
6th Port :
7th Port :
8th Port :
9th Port :
10th Port :
11th Port :
12th Port :
13th Port :
14th Port :
15th Port :
16th Port :
|


|
Example 01> Row 16. NOTE : The result of this case in SlideShow mode is posted here. |
|
csirs = nrCSIRSConfig; csirs.CSIRSType = {'nzp'}; csirs.CSIRSPeriod = {[40 1]}; csirs.Density = {'one'}; csirs.RowNumber = [16]; csirs.SymbolLocations = {[3 7]}; csirs.SubcarrierLocations = {[2 4 6 8]}; csirs.NumRB = 4; csirs.NID = 0; |
|
1st Port :
2nd Port :
3rd Port :
4th Port :
5th Port :
6th Port :
7th Port :
8th Port :
9th Port :
10th Port :
11th Port :
12th Port :
13th Port :
14th Port :
15th Port :
16th Port :
17th Port :
18th Port :
19th Port :
20th Port :
21st Port :
22nd Port :
23rd Port :
24th Port :
25th Port :
26th Port :
27th Port :
28th Port :
29th Port :
30th Port :
31st Port :
32nd Port :
|


|
Example 02> Row 17. NOTE : The result of this case in SlideShow mode is posted here. |
|
csirs = nrCSIRSConfig; csirs.CSIRSType = {'nzp'}; csirs.CSIRSPeriod = {[40 1]}; csirs.Density = {'one'}; csirs.RowNumber = [17];
csirs.SymbolLocations = {[3 7]}; csirs.SubcarrierLocations = {[2 4 6 8]}; csirs.NumRB = 4; csirs.NID = 0; |
|
1st Port :
2nd Port :
3rd Port :
4th Port :
5th Port :
6th Port :
7th Port :
8th Port :
9th Port :
10th Port :
11th Port :
12th Port :
13th Port :
14th Port :
15th Port :
16th Port :
17th Port :
18th Port :
19th Port :
20th Port :
21st Port :
22nd Port :
23rd Port :
24th Port :
25th Port :
26th Port :
27th Port :
28th Port :
29th Port :
30th Port :
31st Port :
32nd Port :
|


|
Example 03> Row 18. NOTE : The result of this case in SlideShow mode is posted here. |
|
csirs = nrCSIRSConfig; csirs.CSIRSType = {'nzp'}; csirs.CSIRSPeriod = {[40 1]}; csirs.Density = {'one'}; csirs.RowNumber = [18]; csirs.SymbolLocations = {3}; csirs.SubcarrierLocations = {[2 4 6 8]}; csirs.NumRB = 4; csirs.NID = 0; |
|
1st Port :
2nd Port :
3rd Port :
4th Port :
5th Port :
6th Port :
7th Port :
8th Port :
9th Port :
10th Port :
11th Port :
12th Port :
13th Port :
14th Port :
15th Port :
16th Port :
17th Port :
18th Port :
19th Port :
20th Port :
21st Port :
22nd Port :
23rd Port :
24th Port :
25th Port :
26th Port :
27th Port :
28th Port :
29th Port :
30th Port :
31st Port :
32nd Port :
|