Matlab Toolbox - 5G/NR
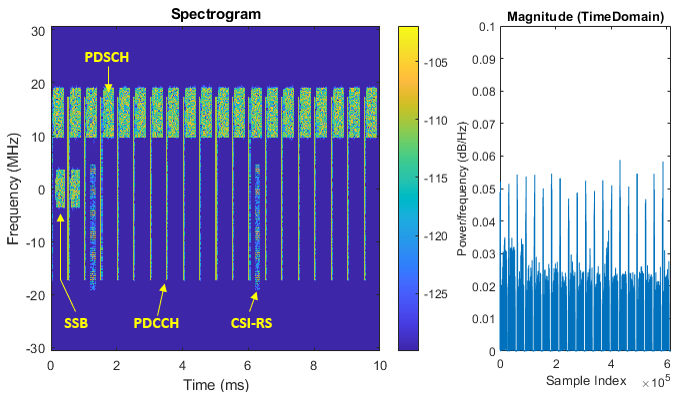
Downlink Spectrogram
NOTE : It is required to have Matlab 5G Toolbox to run this script. Matlab Versionthat I used for this page is 5G Toolbox Version 2.1 (R2020b)
| Following code is basic skeletone of the script for the tutorial on this page. This is a modified code based on 5G Toolbox document linked here. The code shown here is not the full source code for the tutorial. I just copied the only part that is important for the tutorial, so just copy-and-paste would not work. |
|
waveconfig.ChannelBandwidth = 40; waveconfig.FrequencyRange = 'FR1';
scscarriers{1}.SubcarrierSpacing = 30; scscarriers{1}.NSizeGrid = 106; scscarriers{1}.NStartGrid = 1;
bwp{1}.SubcarrierSpacing = 30; bwp{1}.NSizeBWP = 106; bwp{1}.NStartBWP = 1;
coresets{1}.CORESETID = 1; coresets{1}.Duration = 1; coresets{1}.FrequencyResources = [1 1 1 1 1 1 1 1 1 1 1 1 1 1 1 1]; coresets{1}.CCEREGMapping = 'noninterleaved'; coresets{1}.REGBundleSize = 6;
searchspaces{1}.SearchSpaceID = 1; searchspaces{1}.CORESETID = 1; searchspaces{1}.SearchSpaceType = 'ue'; searchspaces{1}.SlotPeriodAndOffset = [1,0]; searchspaces{1}.Duration = 1; searchspaces{1}.StartSymbolWithinSlot = 0; searchspaces{1}.NumCandidates = [1 1 1 1 1];
pdsch{1}.BandwidthPartID = 1; pdsch{1}.TargetCodeRate = 0.4785; pdsch{1}.XOverhead = 0; pdsch{1}.Modulation = 'QPSK'; pdsch{1}.NumLayers = 4; pdsch{1}.RVSequence = [0,2,3,1]; pdsch{1}.VRBToPRBInterleaving = 0; pdsch{1}.VRBBundleSize = 2;
pdsch{1}.SymbolAllocation = [2,9]; pdsch{1}.PRBSet = [80:105];
pdsch{1}.MappingType = 'A'; pdsch{1}.DMRSPower = 0;
pdsch{1}.DMRS.DMRSTypeAPosition = 2; pdsch{1}.DMRS.DMRSLength = 1; pdsch{1}.DMRS.DMRSAdditionalPosition = 0; pdsch{1}.DMRS.DMRSConfigurationType = 2; pdsch{1}.DMRS.NumCDMGroupsWithoutData = 1; pdsch{1}.DMRS.NIDNSCID = 1; pdsch{1}.DMRS.NSCID = 0;
waveconfig.SSBurst = ssburst; waveconfig.SCSCarriers = scscarriers; waveconfig.BandwidthParts = bwp; waveconfig.CORESET = coresets; waveconfig.SearchSpaces = searchspaces; waveconfig.PDCCH = pdcch; waveconfig.PDSCH = pdsch; waveconfig.CSIRS = csirs; |
|
Example 01> Row 1. This example is to visualize a TRS using two sets of one port CSI-RS. |
|
pdsch{1}.NumLayers = 4;
csirs{1}.Power = 3; csirs{1}.CSIRSType = {'nzp','nzp'}; csirs{1}.RowNumber = [1 1]; csirs{1}.Density = {'three','three'}; csirs{1}.SubcarrierLocations = {0,0}; csirs{1}.NumRB = 66; csirs{1}.RBOffset = 0; csirs{1}.SymbolLocations = {6,10}; csirs{1}.CSIRSPeriod = {[10,2],[10,2]};
|
|
1st Port :
2nd Port :
3rd Port :
4th Port :
|


|
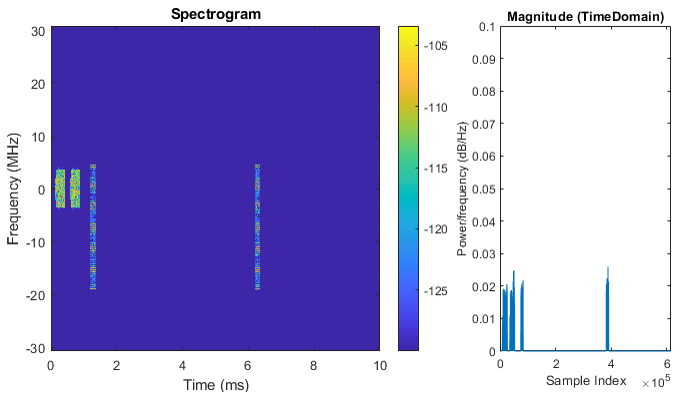
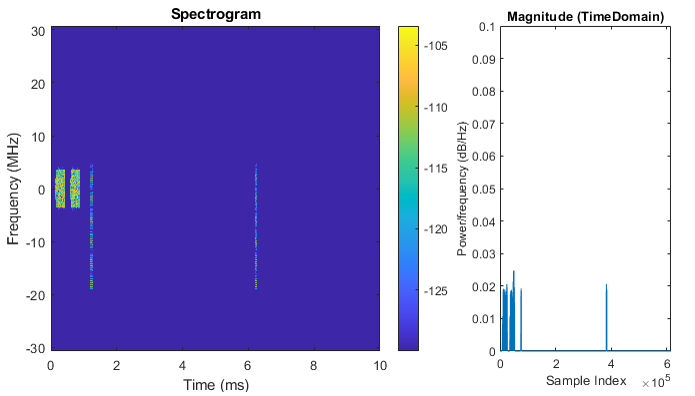
Example 01> Row 6. This example is to visualize a 8 port CSI RS for 4 layer PDSCH |
|
pdsch{1}.NumLayers = 4;
csirs{1}.Power = 3; csirs{1}.CSIRSType = {'nzp'}; csirs{1}.RowNumber = [6]; csirs{1}.Density = {'one'}; csirs{1}.SubcarrierLocations = {[2 4 6 8]}; csirs{1}.NumRB = 66; csirs{1}.RBOffset = 0; csirs{1}.SymbolLocations = {6}; csirs{1}.CSIRSPeriod = {[10,2]}; csirs{1}.NID = 0;
|
|
1st Port :
2nd Port :
3rd Port :
4th Port :
5th Port :
6th Port :
7th Port :
8th Port :
|


|
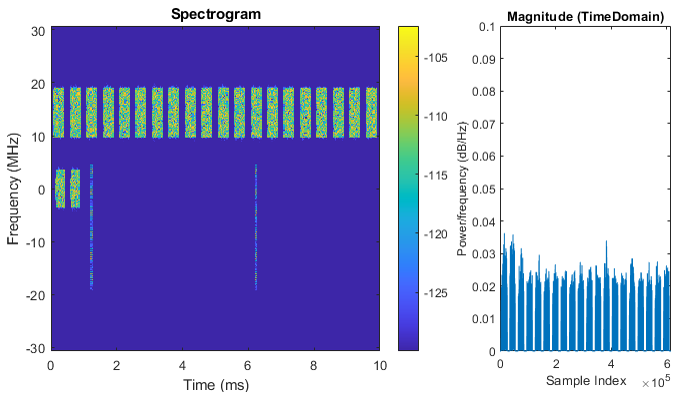
Example 01> Row 18. This example is to visualize a 32 port CSI RS for 4 layer PDSCH |
|
pdsch{1}.NumLayers = 4;
csirs{1}.Power = 3; csirs{1}.CSIRSType = {'nzp'}; csirs{1}.RowNumber = [18]; csirs{1}.Density = {'one'}; csirs{1}.SubcarrierLocations = {[2 4 6 8]}; csirs{1}.NumRB = 66; csirs{1}.RBOffset = 0; csirs{1}.SymbolLocations = {6}; csirs{1}.CSIRSPeriod = {[10,2]}; csirs{1}.NID = 0;
|
|
1st Port :
2nd Port :
3rd Port :
4th Port :
5th Port :
6th Port :
7th Port :
8th Port :
9th Port :
10th Port :
11th Port :
12th Port :
13th Port :
14th Port :
15th Port :
16th Port :
17th Port :
18th Port :
19th Port :
20th Port :
21st Port :
22nd Port :
23rd Port :
24th Port :
25th Port :
26th Port :
27th Port :
28th Port :
29th Port :
30th Port :
31st Port :
32nd Port :
|