If you are already familiar with Calculus, just skip this page. Probably you would easily get bored. But if you fall into any one of the following list, this post would help you.
i) I think I need to study Calculus, but I already got scared of such a big word 'Calculus'. I want to start with more easy and familiar terms.
ii) It's been a long time since I complete my school math (high school, early colledge), I want to fresh up my memory.
iii) I have kids or sister/brothers who just about to study calculus and I want to give them some 'Pre-Calculus' tips.
Simply put, 'Calculus' is to study on 'Rate of Change'.
As in any other topics, the best way to understand this concept is to start with something visual. As you know, the most common visual thing in math is 'Graph'.
So I will start with several graphs to explain the concept of 'Rate of Change' and how it will lead to the concept of calculus.
- Slope represent 'Steepness'
- Thinking Practice
- Linking to Real World - Physics
- Slope on a curve
- How can I get 'Tangent Line' ?
- Application of a Tangent Line - Finding Min/Max
- How to Solve a problem ?
Slope represent 'Steepness'
Slope is the first number calculus gives you. It turns the question of how steep a line is into a ratio of two lengths, and every later idea on this page reuses that ratio.
The rate of change in a graph is represented as 'Slope'. What does it mean by 'Slope' ?
Actually you don't need to be a math geek to understand the concept of Slope. Everybody already knows what the Slope means.
I have two lines in a graph as shown below. If I ask 'Which of the lines is steeper ?', everybody would come out with answer right away. Line (1) is steeper.
Then what if I ask 'How do you represent the steepness in a number ?'. Then you may start scratching your head.
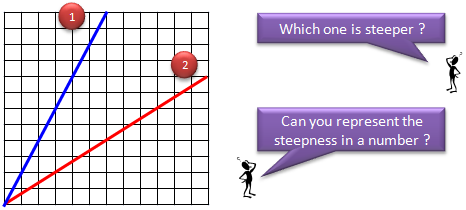
Now let's think about the second question, which is "'How do you represent the steepness in a number ?"
Steepness is defined as follows. It is just a ratio of 'rise' and 'run'. 'Run' indicate the changes in the horizontal direction and 'Rise' indicate the changes in the vertical direction.
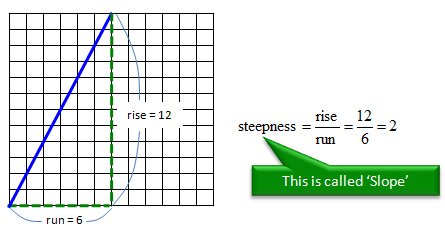
There can be many different ways to define 'run' and 'rise' on a graph. But if the line is 'straight', it doesn't matter how you define the 'run' and 'rise'. As shown in the following example. As long as you define in such a way that 'run' line meets 'rise' line at one point in 90 degree, the ratio of rise and run is always same.
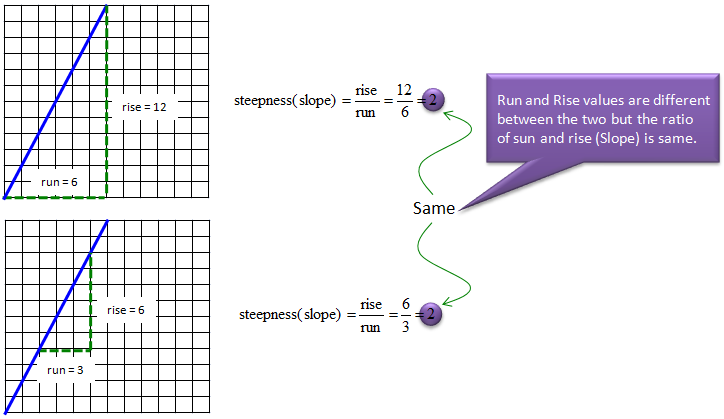
We now know how to represent a steepness into a number. Then what is slope ? Slope is just another name for steepness. They are same thing.
Written with coordinates, the same rule becomes a formula that needs no grid. Take any two points (x1, y1) and (x2, y2) on the line. The slope is (y2 - y1)/(x2 - x1). If the lower left corner of the grid above is (0, 0), line (1) passes through (0, 0) and (6, 12). The formula then gives 12/6 = 2, the same value as the rise and run in the diagrams.
The sign of the slope tells the direction : a positive slope rises from left to right, a negative slope falls, and a zero slope is flat.A larger size means a steeper line : line (2) rises less than line (1) for the same run, so its slope is smaller than 2.A vertical line has no slope : its run is zero, and a ratio with zero at the bottom has no value.Slope carries units : it is units of y per unit of x. This is what turns a slope into a rate of change, as the physics section below shows.
Thinking Practice
I think most of you can recall that you had dealt with this kind of things while you are in high school physics class. You maight have not noticed that this is related to such a big word 'Calculus', but this would give you the insight of the most important aspect of Calculus and this would help you with even university Calculus course as well.
Let's suppose that we have a graph as shown in graph (A). You would not see this kind of graph (made up of multiple segments rather than nice/smooth single curve) in math class, but you would see this kind of graphs pretty often in physics course or more often in various engineering course. In real life, there are not many cases where you can explain with a single/smooth function and in more case you would have to split it into multiple segments and come out with different equations for each of the segments. In this case, you can have the segmented graph as in this example.
Anyway getting back to our main topic (not much about the physical meaning of it), you may intuitively identify the range of each segment of the graph (the green vertical line shows the boundary of each segment).
Now I would ask you to figure out the slope of each segment of Graph (A).
Just based on what I explained above or from high school math class, you can easily come out with the slope value for each of the segment. If you plot the slope of each segment into a graph, you can get a graph (B).
Can you clearly understand the relationship between Graph (A) and Graph (B). In mathematica terms, we can say Graph (B) is the derivative of Graph (A). The process of figuring out Graph (B) from Graph (A) is called 'Differentiation'.
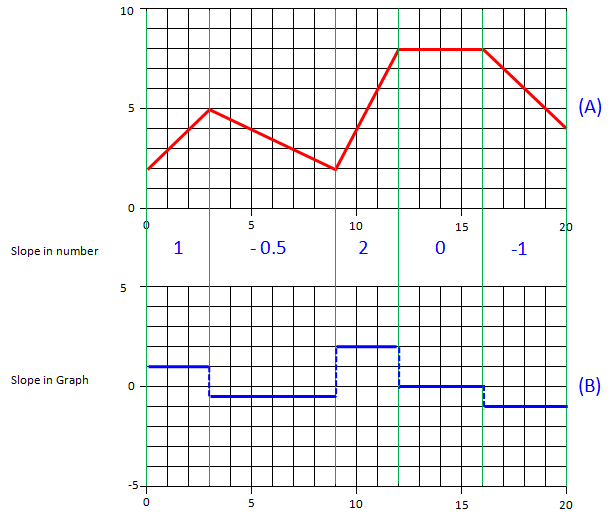
You can check each number in graph (B) with the formula from the previous section. The first segment runs from (0, 2) to (3, 5), so its slope is 3/3 = 1. The second runs from (3, 5) to (9, 2), which gives -3/6 = -0.5. The remaining three segments give 6/3 = 2, 0/4 = 0 and -4/4 = -1.
Graph (B) is flat wherever graph (A) is straight : a straight segment has a single slope, so its derivative is a constant.Graph (B) jumps at every corner of graph (A) : at x = 3, 9, 12 and 16 the slope changes suddenly. The derivative does not exist at those corners, and the dashed vertical lines in graph (B) only connect the levels.Going back from graph (B) to graph (A) is integration : the area under graph (B) from 0 to any x gives the change in graph (A). For example, the area from 0 to 3 is 3 times 1, and graph (A) rises by 3, from 2 to 5. The Integration page starts from this idea.
Linking to Real World - Physics
Physics is where slope first gets a physical meaning. When the horizontal axis is time, the slope of a graph is a rate. The two diagrams below show the two rates that every physics course starts with.
Now let's think of a couple of real life issues and see how it can be associated with the concept of calculus.
First look at the graph on the right side, it would be a kind of graph you might have seen in your high school physics. The horizontal axis represents 'time' and vertical axis represents 'displacement'. The red line on the plot represents the relation between time and displacement.
What is the meaning of the slope of the graph ? Three different types of answers are shown on the left side. I hope you will get familiar with all of the different ways of representation.
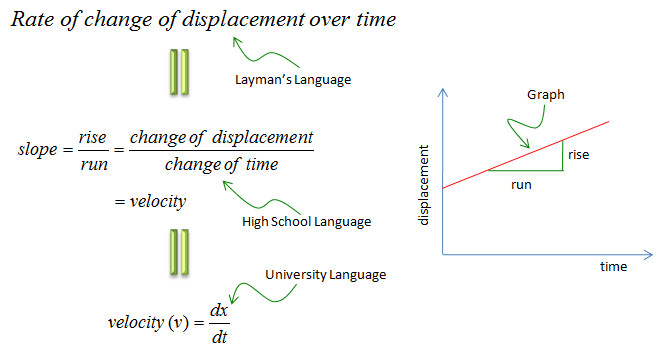
Now look at another example. Look at the graph on the right side, it is exactly the same shape of the graph as you have seen in previous example. The only difference is the meaning of the vertical axis. The horizontal axis represents 'time' and vertical axis represents 'velocity'. The red line on the plot represents the relation between time and velocity.
What is the meaning of the slope of the graph ? Three different types of answers are shown on the left side. I hope you will get familiar with all of the different ways of representation.
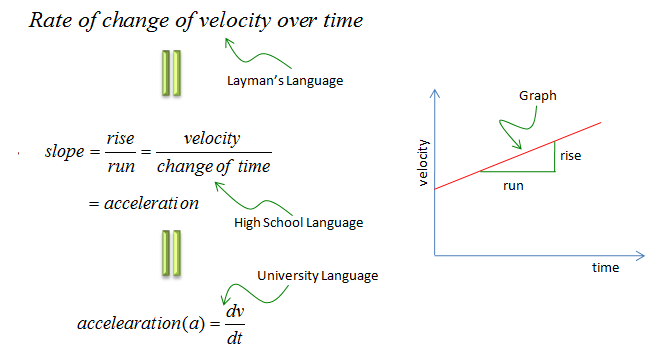
Two labels in the diagram above need a correction. In the high school formula, the numerator should read "change of velocity", because a slope always divides a change by a change. The last line spells acceleration as "accelearation". Apart from these labels, the two diagrams make the same point: the slope of one graph is the quantity plotted on the next one.
Displacement, velocity and acceleration form a chain : velocity is the slope of the displacement graph, and acceleration is the slope of the velocity graph. So acceleration is the second derivative of displacement, written d2x/dt2.The slope carries the units of the chain : displacement in metres over time in seconds gives velocity in m/s. Velocity in m/s over time in seconds gives acceleration in m/s2.A straight line means a constant rate : both red lines are straight. So the velocity in the displacement diagram and the acceleration in the velocity diagram are constant.The same pattern appears in circuits : current is the rate of change of charge, i = dq/dt. The Differentiation page lists more engineering examples.
Slope on a curve
Now let's think of a little bit tricky situation. Suppose you are told to figure out the slope at a point on a curve as shown below.
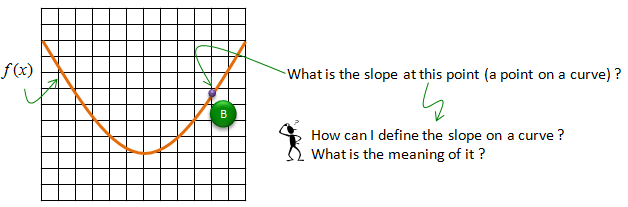
Assuming that you haven't got any basic calculus course, your first response would be "I learned only about getting the slope on a straight line. What do you mean by getting the slope on a curve ?".
It is a good question. The first step is to figure out the meaning (definition) of the slope on a curve. The slope on a curve is defined as the slope of the straight line which is tangential to the point on the curve as illustrated below.
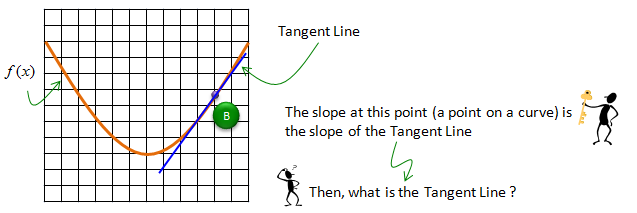
Now I know what you will ask next -:). You would ask what is Tangent line ? The definition of tagential line goes as follows.
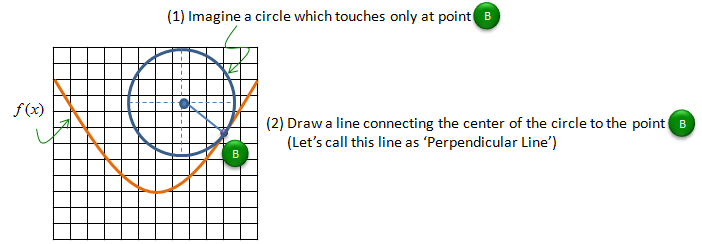
First, think that you have an imaginary circle which is touches on only one point (point B as shown below). Then draw a line between the center of the circle and the point (Point B) on the curve.
Now draw a line which is passing through the point and form the right angle to the line you draw above. This line is called the tangential line of the curve on a point (B).
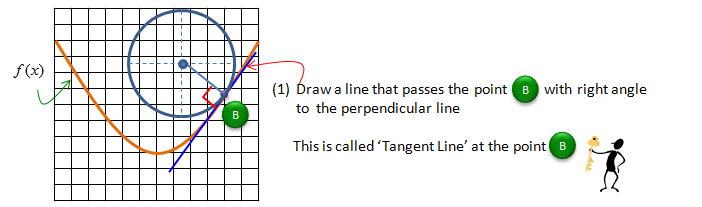
Now with a long procedure, we figured out how to get the tangential line of a curve at a certain point. When you are told to get a slope on a curve at a certain point, what you have to do is to get a slope of the tagent line on a curve at the specified point.
The circle construction needs one condition. The circle must touch the curve at B without crossing it there, so the circle and the curve share the same direction at B. With that condition, the line from the centre to B is perpendicular to the curve. The diagram calls it the 'Perpendicular Line', and textbooks call it the normal line. The line at right angles to it is the tangent line.
The tangent line follows the curve at one point : near B the curve and its tangent line are almost the same. That is why the slope of the tangent line can stand for the slope of the curve.A tangent line can meet the curve again elsewhere : "touches at only one point" describes the neighbourhood of B, not the whole graph. For y = x3, the tangent line at x = 1 is y = 3x - 2, and it meets the curve again at x = -2.The slope changes from point to point : on the curve in these diagrams, the tangent is steep near the right edge, flat at the bottom and falling on the left side. The derivative is the function that records the slope at every point.
How can I get 'Tangent Line' ?
The circle construction defines the tangent line, but it is not a practical way to compute its slope. Two practical methods exist, and one of them leads straight to the derivative.
Then how can I calculate the slope of the tangent line ? Do I have to go through the long procedure explained above every time ?.
Fortunately you have a better way as summarized below. There are mainly two method. One is a kind of Geometrical/Graphical method and the other method is Algebraic method.
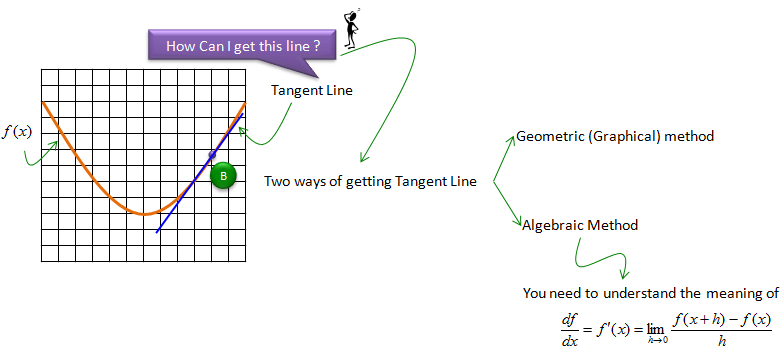
Actually the algebraic method shown above is the center piece of 'Calculus' which will be explained in detail in the concept of Limit page.
Here in this page, let's briefly think of the graphical method. (Even though I said 'Graphical Method', it still need a little bit of basic calculation'. That calculation is same as what you have done to get the slope of straight line at the beginning of this page).
Before I explain the procedure, I would like you to go through the following sequence of graphs and see if you figure out the method on your own. Start from graph (1) and move to (2) and (3) and (4). The last graph (Graph (4)) would give you the slope of the tagential line.
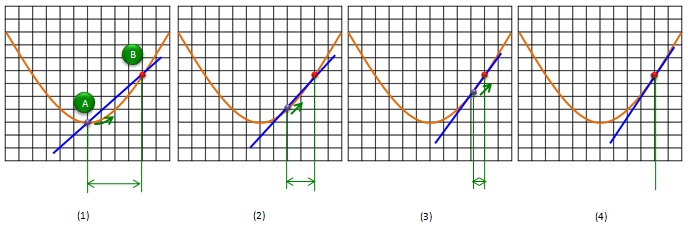
Here is what the four graphs do. Graph (1) draws a straight line through point B and a second point A on the curve. This line is called a secant, and its slope is rise over run between A and B. Graphs (2) and (3) slide A toward B, so the run shrinks and the secant turns. In graph (4), A has reached B and the secant has become the tangent line.
Numbers show the same thing. Take f(x) = x3 and put B at x = 2, where f(2) = 8. Put A a distance h to the right of B, and compute the secant slope (f(2 + h) - f(2))/h. The table below shows how that slope settles as h shrinks.
h |
f(2 + h) |
Secant slope |
1 |
27 |
19 |
0.1 |
9.261 |
12.61 |
0.01 |
8.120601 |
12.0601 |
0.001 |
8.012006001 |
12.006001 |
The slope approaches 12, which is 3 times 22, the value of the derivative 3x2 at x = 2. Letting h approach 0 is exactly the algebraic formula in the diagram above, f′(x) = lim (f(x + h) - f(x))/h as h → 0. The Limit page explains what "approach" means here.
The graphical method and the algebraic method are one method : both take the slope of a secant and let its run shrink toward zero.A secant can always be computed, a tangent cannot : rise over run needs two points, and a tangent has only one. The limit is the tool that removes the second point.A small h already gives a good estimate : with h = 0.001 the secant slope is within 0.006 of the true value. Numerical differentiation on a computer uses this idea, as the Numerical Diff page shows.
Application of a Tangent Line - Finding Min/Max
The tangent line gives a quick way to find the highest and lowest points of a curve. At the bottom of a valley or the top of a hill, the tangent line is flat. So the search for a minimum or a maximum becomes a search for the points where the slope is zero.
The diagrams below take the minimum first and the maximum second. The last one asks how to tell the two apart.
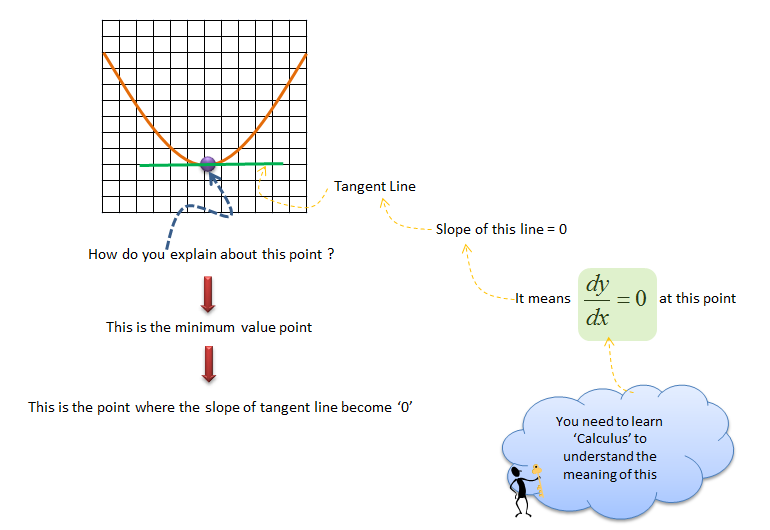
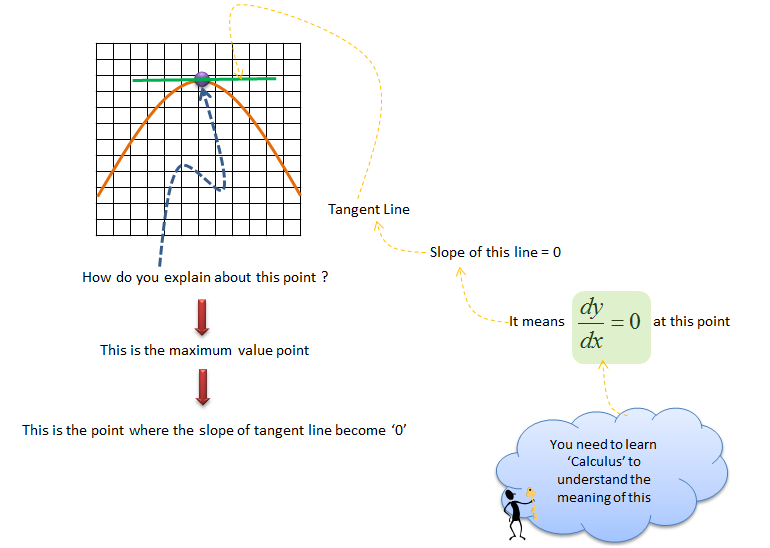
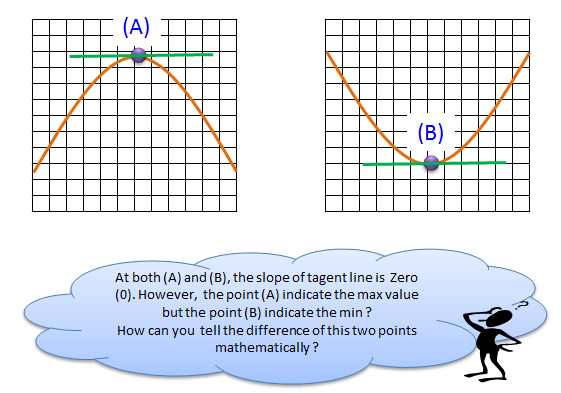
The question in the cloud has a standard answer, called the second derivative test. Watch how the slope changes as you pass the point. At (B) the slope goes from negative through zero to positive, so the slope is increasing and d2y/dx2 is positive. At (A) the slope goes from positive through zero to negative, so d2y/dx2 is negative.
Take y = x3 - 3x as an example. Its derivative is 3x2 - 3, which is zero at x = -1 and at x = 1. The second derivative is 6x. At x = -1 it is -6, so the curve has a maximum there, with y = 2. At x = 1 it is 6, so the curve has a minimum there, with y = -2.
dy/dx = 0 finds the candidates : every smooth maximum or minimum has a flat tangent line. So solving dy/dx = 0 lists all of them.A flat tangent does not guarantee a maximum or a minimum : y = x3 has dy/dx = 0 at x = 0, but the curve keeps rising through that point. The second derivative there is also 0, so the test gives no answer. The sign of the slope on each side decides instead.These answers are local : a minimum found this way is the lowest point nearby. On a limited interval, also check the end points, because the lowest value of the whole interval can sit there.
How to Solve a problem ?
Once the meaning of the derivative is clear, most problems come down to a short list of known results. The two pages below hold that list: a table of derivatives for common functions, and the rules for combining them.
Derivative Table : Click Here
Differentiation Rule : Click Here
Let's see how the two lists work together on a small example. Take y = x3 + 2x. The derivative table gives 3x2 as the derivative of x3, and 1 as the derivative of x. The sum rule and the constant multiple rule then combine them into dy/dx = 3x2 + 2. At x = 2 this is 14, and the secant method with h = 0.001 gives 14.006.
A product needs one more rule. For y = x2 sin x, the product rule gives dy/dx = 2x sin x + x2 cos x. Neither the table nor a single rule gives this alone, so the two pages are meant to be used together.
The table covers the building blocks : powers, exponentials, logarithms and trigonometric functions.The rules cover how the blocks are joined : sums, constant multiples, products and quotients, and functions inside functions through the chain rule.A secant checks the result : compute (f(x + h) - f(x))/h for a small h, as in the tangent line section. If the two numbers disagree, one of the rules was applied wrongly.