As the name implies, millimeter wave is a electro magnetic wave with the wavelength falling into the scale of millimeter. Usually it refers to the wavelength of 10~1 mm.
If you convert the wavelength into frequency : 1 mm corresponds to 300 Ghz and 10 mm corresponds to 30 Ghz. However, like many other concepts, the exact range of 'Millimeter Wave' is not clearly defined. Somebody call it millimeter wave if it is higher than 20 Ghz and some other person has other range definition.
- Well known spectrums in mmWave
- Oxygen Aattenuation versus Frequency
- Rain Attenuation
- Which spectrum is used for 5G ?
- Baseline Pathloss
- Transmission Loss
- Outdoor to Indoor Penetration
- Reference
Well known spectrums in mmWave
The letter names below come from radar and waveguide practice, and 3GPP does not use them. You will still meet them constantly, because component datasheets, antenna specifications and regulatory filings are all written in them. It is worth knowing which letter covers the frequency you work at.
Within the spectrum of millimeter wave, there are several commonly used bands. Some of these commonly used bands are :
- Ka band : 26.5 ~ 40 Ghz
- Q band : 33 ~ 50 Ghz
- V band : 50 ~ 70 Ghz
- W band : 75 ~ 110 Ghz
- D band : 110 ~ 170 Ghz
Two things about that list are easy to miss. The first is that the ranges overlap. Ka runs up to 40 Ghz and Q starts at 33 Ghz, so 33 to 40 Ghz carries both names. A band letter on its own therefore does not fix a frequency.
The second is that the two frequencies measured throughout this page fall in different bands. 28 Ghz is in Ka and 60 Ghz is in V. That split matters for everything below. Ka sits under the oxygen absorption line and V sits on top of it, which is why Baseline Pathloss and Transmission Loss report both frequencies side by side.
The letter names are not 3GPP names : they come from radar and waveguide practice, and 3GPP labels its own ranges FR1 and FR2 instead.The letter bands overlap : 33 to 40 Ghz is both Ka and Q, so a band letter does not identify a frequency on its own.Ka and V are the two that matter here : 28 Ghz is in Ka and 60 Ghz is in V, the two frequencies measured on this page.
Oxygen Aattenuation versus Frequency
The 60 Ghz oxygen absorption peak is the reason millimeter wave has a reputation for short range. It is worth seeing where that peak actually sits, because the band 5G uses is not on it.
The chart plots atmospheric attenuation in dB/Km against frequency, from 10 to 400 Ghz, on logarithmic axes. Two curves are drawn. The upper one is measured at sea level, and the lower one at 9150 meters altitude. The named peaks are the absorption lines of H2O near 22 Ghz, O2 near 60 Ghz, O2 again near 118 Ghz, and H2O near 183 Ghz and 325 Ghz. The green band marks 5G-FR2 as defined in Release 15, from 24.25 to 40.00 Ghz.
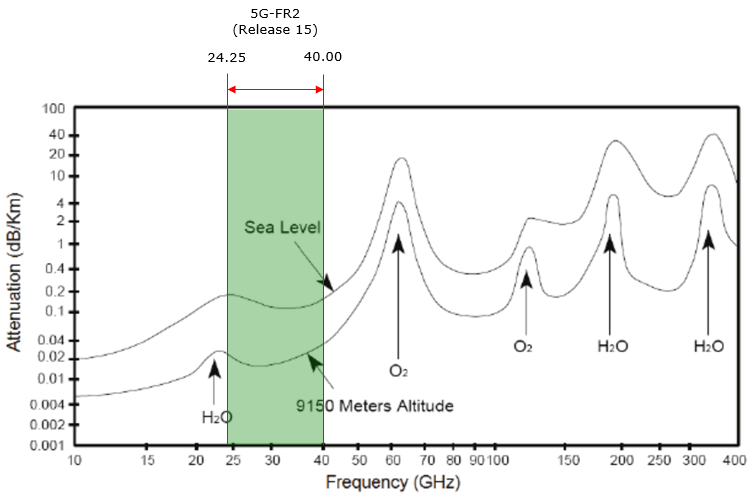
Figure 1. The Release 15 definition of 5G-FR2 sits in the valley between the 22 Ghz water vapour line and the 60 Ghz oxygen line. The oxygen peak that millimeter wave is known for therefore does not apply to the band 5G deploys in.
The distance between the two curves is the reason for drawing them together. At 9150 meters most of the atmosphere is already below the receiver. The absorption lines therefore shrink to a fraction of their sea level height. A link that is unusable near the ground can be ordinary at altitude.
Inside the shaded 5G-FR2 band the sea level curve stays between about 0.1 and 0.2 dB/Km. Over a cell of 200 m that is under 0.05 dB. The free space path loss in Baseline Pathloss is already over 80 dB at 9.6 m. For a 5G cell in FR2, the atmosphere is not the term that limits range.
The 60 Ghz oxygen peak is outside the 5G FR2 band : Release 15 FR2 stops at 40.00 Ghz, and the oxygen line sits 20 Ghz above that.Atmospheric absorption is negligible at FR2 cell sizes : 0.2 dB/Km over 200 m is under 0.05 dB, against a free space loss of over 80 dB.Altitude removes most of the absorption : the 9150 meter curve runs far below the sea level curve at every peak.The absorption lines are narrow : H2O near 22 Ghz and O2 near 60 Ghz are peaks, so a few Ghz of tuning avoids them.
Rain Attenuation
Oxygen absorption gets the attention, and for an outdoor link it is the wrong term to worry about. The atmospheric term that matters is rain. I want to put a number on it here, because the gap between the two is much larger than most summaries suggest.
ITU-R P.838-3 gives specific attenuation as a power law of rain rate. The attenuation in dB/Km is k multiplied by R raised to the power alpha, where R is the rain rate in mm/h. Both k and alpha depend on frequency and on polarisation. At 28 Ghz the horizontal coefficients are k = 0.2051 and alpha = 0.9679. At 60 Ghz they are k = 0.8606 and alpha = 0.7656.
< Specific attenuation for rain, computed from ITU-R P.838-3 >
|
Rain rate |
28 Ghz horizontal |
28 Ghz vertical |
60 Ghz horizontal |
60 Ghz vertical |
|
5 mm/h, light |
0.97 dB/Km |
0.87 dB/Km |
2.95 dB/Km |
2.84 dB/Km |
|
25 mm/h, moderate |
4.62 dB/Km |
3.89 dB/Km |
10.12 dB/Km |
9.48 dB/Km |
|
50 mm/h, heavy |
9.04 dB/Km |
7.40 dB/Km |
17.20 dB/Km |
15.92 dB/Km |
|
100 mm/h, downpour |
17.69 dB/Km |
14.08 dB/Km |
29.24 dB/Km |
26.75 dB/Km |
Set those figures against the atmosphere. Sea level absorption inside FR2 runs between about 0.1 and 0.2 dB/Km. Moderate rain at 28 Ghz is 4.62 dB/Km, which is more than twenty times as much. Rain is the atmospheric term worth modelling, and oxygen is not.
Distance then decides whether even rain matters. Across a 200 m street cell, moderate rain at 28 Ghz costs 0.92 dB. Across a 2 km fixed wireless access link the same rain costs 9.2 dB, and a downpour costs 35.4 dB. That is the difference between a rounding error and a link that drops.
Rain beats oxygen by more than an order of magnitude : moderate rain is 4.62 dB/Km at 28 Ghz, against 0.1 to 0.2 dB/Km for the atmosphere itself.Attenuation rises with frequency : the same 25 mm/h costs 4.62 dB/Km at 28 Ghz and 10.12 dB/Km at 60 Ghz.Vertical polarisation loses less than horizontal : raindrops flatten as they fall, so they present a larger cross section to a horizontal field.Cell size decides whether rain matters at all : 0.92 dB across 200 m is negligible, and 35.4 dB across 2 km is not.
Which spectrum is used for 5G ?
Which of the spectrum listed above is used for 5G ? As you see in this table, Ka band is used for the initial deployment of 5G and V band would be the next target (future release) for 5G.
Figure 1 explains that ordering. The shaded 5G-FR2 band, 24.25 to 40.00 Ghz, sits in the quiet stretch between the water vapour line and the oxygen line. Ka is therefore the cheapest place to start, because the atmosphere costs almost nothing across it.
Moving to V band is a design decision, and not simply a move up in frequency. V band contains the oxygen line, so a V band cell is short range by physics rather than by choice. That suits dense indoor deployment and fixed wireless access, where a small cell and low interference between neighbouring cells are wanted anyway.
Ka came first because the atmosphere is quiet there : 24.25 to 40.00 Ghz falls between the two nearest absorption lines.V band is short range by physics : it contains the 60 Ghz oxygen line, so range falls away with no need to reduce power.Short range is sometimes the feature : dense indoor and fixed wireless deployments want small cells and little interference between them.
Baseline Pathloss
According to Ref [3], the baseline pathloss between Transmitter and Reciever is as follows. You would notice that the pathloss gets over 80 dB at 28 Ghz and over 88 dB just 10 m away from transmitter. The loss difference between 5m and 10 m is around 6dB. For the detailed description on test condition and beam characteristics, refer to Ref [3]. Compare this result with what is described in this page.
Figure 2 and Figure 3 compare the theoretical free space path loss with the measured value, at 4.6 m and at 9.6 m. Figure 2 is 28 Ghz and Figure 3 is 60 Ghz.
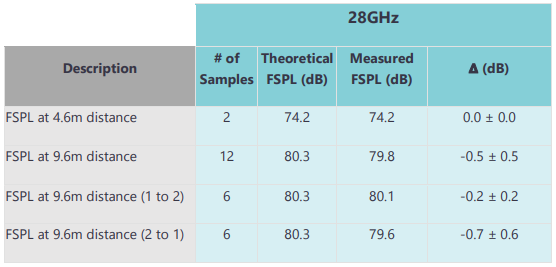
Figure 2. At 28 Ghz the measured free space path loss follows the theoretical value closely, and the largest gap in the table is 0.7 dB. Moving from 4.6 m to 9.6 m adds about 6 dB.
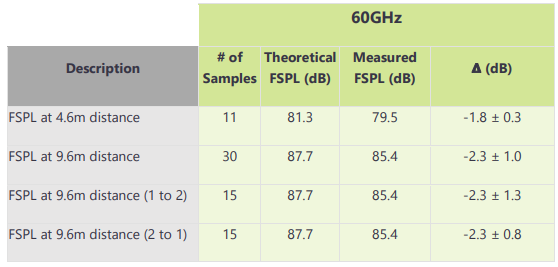
Figure 3. At 60 Ghz the measured loss runs below the theoretical value at both distances, by 1.8 dB at 4.6 m and by 2.3 dB at 9.6 m. For the same distance the loss is about 7 dB higher than at 28 Ghz.
Free space path loss is the floor, and not the answer. It assumes nothing at all between the two antennas. Every number in Transmission Loss is added on top of it, and so is any loss from a beam that does not point where it should.
The two tables also confirm the frequency term. Free space loss grows with the square of frequency, which is 6 dB for every doubling. 28 Ghz to 60 Ghz is slightly more than a doubling, and the tables show about 7 dB between them at the same distance. Distance behaves the same way, and 4.6 m to 9.6 m costs about 6 dB.
Free space loss is the best case : it assumes a clear path, so every material in the next section adds to these numbers.Measurement tracks theory closely at 28 Ghz : the largest disagreement in that table is 0.7 dB.At 60 Ghz the measured loss is below theory : the gap runs from 1.8 to 2.3 dB, which indoor reflections can produce.Doubling frequency or distance costs about 6 dB : both tables show it, and it is the quickest check on any millimeter wave link budget.
Transmission Loss
One of the strongest passimisim about utilizing mmWave in wirelss communication has been poor penetration (high transmission loss) for most of materials that surrounds us. In this section, I will consolidate experimental data showing the penetration characteristics of mmWave. As you may easily guess, the penetration loss would be different on the characteristics of the material through which the mmWave passes and the thickness of the material.
Wood
According to Ref [3], the penetration loss measured for Plywood is around 5 dB at 28 Ghz and the loss difference between 12 and 18 mm is just about 0.5 dB. The loss gets lower with incident angle of the wave. It is around 2 dB lower at the incident angle 45 comparing to the incident angle 0.
Drywall
According to Ref [3], the penetration loss measured for Drywall is a little less than I expected. At 28Ghz, the loss is around 1dB with 1 layer 12 mm thickness and 2.5 dB with 4 layer 48 mm thickness. At 60Ghz, the loss is around 1.5dB with 1 layer 12 mm thickness and 5.2 dB with 4 layer 48 mm thickness.
Glass
There are so many variants of glass and the penetration loss also varies a lot with the type of the glass. The two glasses measured below differ by about 24 dB at 28 Ghz. Most of that difference comes from the coating rather than from the glass. A low-emissivity window carries a thin metallic coating to reflect heat, and that coating also reflects millimeter waves.
According to Ref [3], the penetration loss measured for what the paper calls Glass #1 is around 27 dB at 28Ghz and 33 dB at 60 Ghz (NOTE : Glass #1 is described as low-emissivity double-pane window glass that is representative of glass commonly used in window interfacing between interiors and the outside). The loss for what the paper calls Glass #2 is just around 3dB at both 28Ghz and 60Ghz. (NOTE : Glass #2 seems to be a regular glasses).
Foliage
The penetration loss varies depending on the density of the foliage and which part of the foliage the wave get through (i.e, the distance between the center of the foliage and the center of wave propagation).
According to Ref [3], I don't see such a huge difference in terms of the loss among different densities but see wide differences depending on which part of the foliage the wave pass through. When the wave pass through the center of the foliage the 20 ~ 30 dB.
A willow tree measured at 26 Ghz gives a rate as well as a total (Ref [10]). A single tree blocked at the trunk cost 18.50 dB. A run of trees cost between 12.80 dB and 22.42 dB, depending on how dense the growth was. Expressed as a rate, the loss through foliage ran from 0.97 to 1.22 dB per meter.
Human Body
Every material above stays where it is. A person does not, and a person standing in the path is the blocker a millimeter wave link meets most often. It is also the only one that arrives in the middle of a call.
A body crossing the path was measured at 26 Ghz and 39 Ghz on a 15 m link (Ref [10]). Both antennas stood 1.3 m above the ground. The subject was 0.49 m across the shoulders and 0.24 m thick. The subject crossed the line between the antennas in steps of 2.5 cm. The peak attenuation was 12.66 dB at 26 Ghz and 19.03 dB at 39 Ghz.
Two things follow from those two numbers. The first is that a body costs more than any building material listed above except coated glass. The second is that the loss climbs steeply with frequency. A step of 13 Ghz added more than 6 dB. A knife edge diffraction model tracked the measurement to within about 2 dB RMS at both frequencies. The blockage therefore behaves like an obstacle edge rather than like a material.
Drywall is close to transparent : 1 dB through one 12 mm layer at 28 Ghz, and 5.2 dB through four layers at 60 Ghz.Plywood costs about 5 dB and thickness barely matters : 12 mm and 18 mm differ by about 0.5 dB.Coated glass is the real wall : 27 dB at 28 Ghz and 33 dB at 60 Ghz for low-emissivity double pane, against about 3 dB for plain glass.Foliage depends on where the beam passes : through the center it is 20 to 30 dB, and density matters far less than aim.Angle of incidence helps : plywood loses about 2 dB less at an incident angle of 45 than at 0.A person is the blocker that moves : 12.66 dB at 26 Ghz and 19.03 dB at 39 Ghz, arriving with no warning.
Outdoor to Indoor Penetration
Every number in Transmission Loss is one material measured on its own. A building is not one material. It is a wall, a window, a coating and a frame together. The number that decides whether FR2 reaches a living room is measured through all of them at once.
Two buildings were measured at 28 Ghz in a fixed wireless access scenario (Ref [8]). The first was a single family unit at 185 m from the transmitter. The second was a multi-story brick building at 114 m. At each building the receivers sat just outside a front window, and then at 40 cm, 1.4 m and 2.4 m inside it.
< Outdoor to indoor penetration measured at 28 Ghz >
|
Building |
Distance |
Mean outdoor path loss |
Mean indoor path loss |
Mean excess loss |
|
Single family unit |
185 m |
127.8 dB |
138.4 dB |
10.6 dB |
|
Multi-story brick building |
114 m |
117 dB |
139.7 dB |
22.7 dB |
The brick building cost more than twice as much as the house. The difference is attributed to the brick walls and to the smaller number of windows.
The mean hides the more useful result. Take the point immediately outside a window and the point immediately inside the same window. At the single family unit that step ranged from 1 dB to 21.5 dB. One window on a house can be twenty decibels better than the window next to it.
The outdoor numbers deserve a second look as well. Free space path loss at 185 m and 28 Ghz is 106.7 dB. The measured outdoor path loss at the single family unit averaged 127.8 dB, because trees shadowed the direct path. Twenty one decibels were already spent before the wave reached the wall.
A building costs far more than any single material in it : at 28 Ghz, 10.6 dB for a single family unit and 22.7 dB for a multi-story brick building.Construction decides the number : brick walls and fewer windows more than doubled the mean excess loss between the two buildings.Windows are not interchangeable : on one house the excess loss through a window varied from 1 dB to 21.5 dB.Foliage is spent before the wall is reached : the outdoor receivers already sat 21 dB above free space, from tree shadowing alone.Depth into the room mattered little in the brick building : path gains at 40 cm, 1.4 m and 2.4 m from the window varied little, because the paths were alike.
Reference
[1] Millimeter Waves Will Expand The Wireless Future. I strongly recommend you to read the article, it will give you very practical insight on Millimiter wave.
[2] TWS 2015: Millimeter Wave for 5G
[3] Analysis of 28GHz and 60GHz Channel Measurements in an Indoor Environment
[4] 28-GHz Indoor Channel Measurements and Analysis of Propagation Characteristics
[5] Indoor mm-Wave Channel Measurements: Comparative Study of 2.9 GHz and 29 GHz
[6] Outdoor-to-Indoor Channel Measurement and Coverage Analysis for 5G Typical Spectrums
[8] Outdoor to Indoor Penetration Loss at 28 GHz for Fixed Wireless Access
[9] Outdoor-to-Indoor Channel Measurement and Coverage Analysis for 5G Typical Spectrums
[10] Attenuation by a Human Body and Trees as well as Material Penetration Loss in 26 and 39 GHz Millimeter Wave Bands
[11] Beamforming Simulations for 5G mmWave and FD MIMO (YouTube)
[12] ITU-R P.838-3 : Specific attenuation model for rain for use in prediction methods