When I am trying to learn anything in technology (pure science or engineering), usually I assume a blackbox and define inputs(first step) and output(last step), and then write down all the intermediate steps as much as I can think of. I found this has been pretty useful approach for me. Even though this may sound simple, but it would not be that easy when you really tries. Gathering information (knowledge) about those intermediate steps just by reading textbooks and industry standards would take huge amount of time and efforts. One of the best way to do this is to have an experts in the area and get some professional tutoring. Yes... I know this is not easy either. First, finding the expert around yourself would be difficult and finding the experts who has williness and capability to explain things in a way that beginners to understand would be even more difficult. Fortunately I came to know an expert who turned out to be the best fit for me and this tutorial is from the chat for about an hour in front of a whiteboard. His name is Hong Kirby.
Let's follow one example signal through the whole chain. It is a 20 MHz wide channel at an IF of 140 MHz, sampled at 80 Msps, and it reaches the FFT as I and Q at 20 Msps each. The sections below follow the chain in order, from the IF filter to the sample rate reduction. The Stupid Question section explains why the spectra are drawn with a slope, and the last section collects the design questions that come up on the way.
- Overall Procedure - Scope of the tutorial
- Starting Point
- Stupid Question ?
- Filtering IF signal
- Converting Analog to Digital - Sampling
- Pusing the frequency down to Baseband
- Reducing the number of samples
- More questions ?
- Reference
Overall Procedure - Scope of the tutorial
The scope of this tutorial is illustrated as below. My goal is to go through this block from the beginning (Antenna) through the end(FFT block) in this case. This is just an example of an reciever chain that I am interested in. The details would vary depending on the specific application of the reciever chain. In this tutorial, my focus would be mostly around (a)~(i) and (4)~(12). I would not talk much of (1),(2),(3) and (12) in this page.
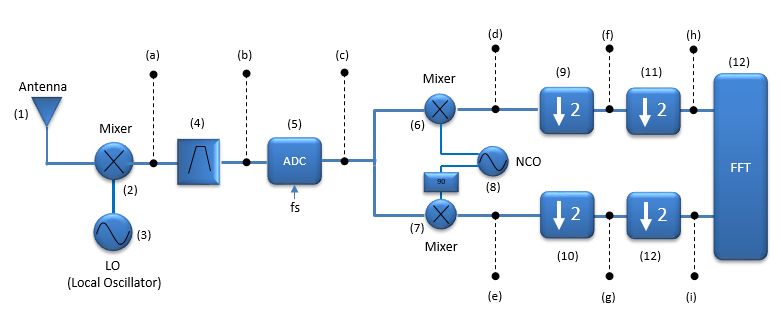
- (1) Antenna, (2) Mixer and (3) LO convert the RF signal to the IF. (4) is the IF bandpass filter, and (5) is the ADC with its sampling clock fs.
- (6) and (7) are digital mixers driven by the NCO (8). The block marked 90 shifts the NCO by 90 degrees for the lower branch, so the two branches produce I and Q.
- (9) to (12) are decimate by 2 stages, two in each branch, and the FFT closes the chain. The drawing uses the label (12) twice, for the second decimator of the lower branch and for the FFT. So (12) in the text means the decimator in "(11) and (12)", and it means the FFT in "I would not talk much of (1),(2),(3) and (12)".
- The test points (a) to (i) mark where the spectrum plots of the later sections are taken.
The ADC (5) divides the chain into two halves. Everything to its left is analog and works on a continuous signal. Everything to its right is digital and works on numbers at the sample rate. This type of receiver is often called an IF sampling or digital IF receiver, because the second frequency conversion, from the IF down to baseband, happens in the digital part. A direct conversion receiver is different. Its analog mixer goes straight to I and Q at baseband, and two ADCs sample them, as described in Homodyne.
Starting Point
Even though the block diagram starts with Antenna, my focus in this page is more of processing an IF analog signal to baseband digital signal which is about to get into DSP process.
In this block, we assume that the LO(3) and Mixer(2) downconverts the signal always to the frequency of 140 Mhz as marked in red in the plot(a) shown below.
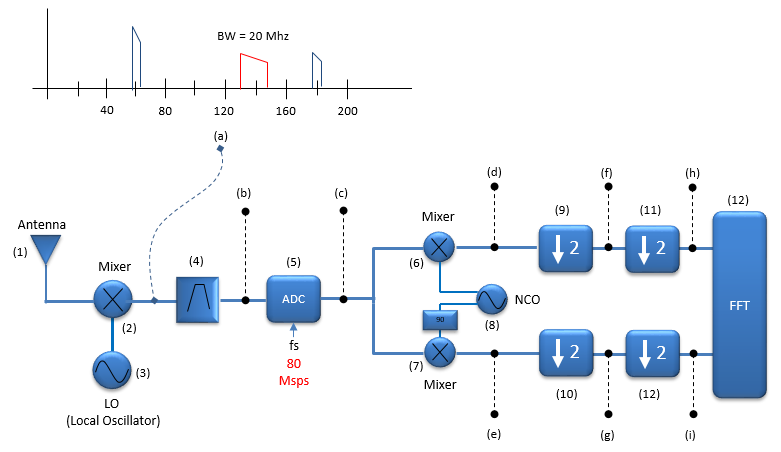
- The red signal is the wanted channel, labeled BW = 20 Mhz. It is centered at 140 MHz, so it spans 130 MHz to 150 MHz.
- The blue signals near 60 MHz and near 180 MHz are other signals that also leave the mixer at point (a), for example other channels or mixing products.
- The ADC clock fs is marked 80 Msps in red. This number appears in every later section.
Let's see how LO(3) puts the channel at 140 MHz. For a channel at 2140 MHz, the LO can sit at 2000 MHz, below the channel, or at 2280 MHz, above it. Both settings give an IF of 140 MHz. However, the choice has a side effect. With the LO below the channel, the IF is RF - LO, and the upper edge of the channel stays at the upper edge of the IF. With the LO above the channel, the IF is LO - RF, so the upper edge of the channel moves to the lower edge of the IF. In other words, the spectrum is inverted. The next section explains why this matters.
The mixer also converts a second frequency to the same IF. This image frequency sits on the other side of the LO, 2 x IF away from the wanted channel. It is 1860 MHz for the LO at 2000 MHz, and 2420 MHz for the LO at 2280 MHz. An RF filter before the mixer must remove it, because after the mixer it overlaps the wanted signal. This part of the chain is outside the scope of the tutorial.
The digital part always sees the same IF : the LO moves with the channel, so the wanted signal always arrives at 140 MHz.An LO above the channel inverts the spectrum : the IF is then LO - RF, and the band edges change places.The image frequency is 2 x IF away from the channel : it must be filtered before the mixer, not after it.
Stupid Question ?
This may not sound so technical .. but I have this question for quite a long. When I first got into this field (wireless / celluar communication) without much theorectical background, I just started with playing with various equipments like signal generator, spectrum analyzer, network analyzer etc. If you take a measurement of frequency response for any real life signal or real life RF devices you would see pretty flat and symmetric (symmetric at least in passband section) as illustrated as shown in (B). But when I see the textbook or articles about DSP(digital signal processing), I noticed the frequency domain wave form is represented as an asymmetric form as shown in (A). I've been wondering for a while, why they draw it like this.
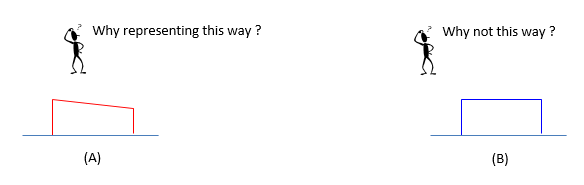
The simple answer is to represent the case of spectral inverse (spectral flipping). In the process of digital processing, there are cases where the spectrum (frequency domain waveform) flips around. If we represent the waveform in symmetric, it is impossible to recognize whether it is 'inversed spectrum(flipped spectrum)' or the original spectrum as in (B) shown below. If we represent the waveform in asymmetric form, it is easy to make the difference between the orignal form and inversed form as in (A) shown below.
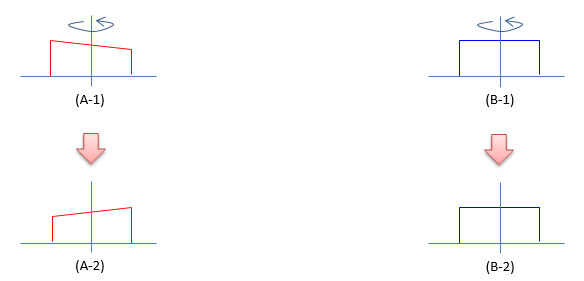
Now you may ask 'why and when this kind of spectral inversion happens ?'. This is not a scope of this tutorial, but it is good question. Refer to Ref [1] or Ref[2] if you are seriously interested on it.
In this tutorial the flip is not only a theoretical case. The sampling section shows that the ADC moves the 140 MHz IF down to 10 MHz to 30 MHz. On the way, it exchanges the upper and the lower edge of the signal. The asymmetric drawing of (A) is what makes this visible. At point (a), the tall edge of the red signal is at 130 MHz. After the ADC, the tall edge is at 30 MHz.
The receiver must know the final orientation. For an OFDM signal, an inverted spectrum puts the subcarriers in reverse order at the FFT output. Two inversions cancel each other, for example an LO above the channel together with an inverting sampling step. So the designer tracks each step, and the digital part corrects the result once, as shown in the baseband section.
The slope in the drawing shows the orientation of the spectrum : a symmetric drawing looks the same before and after an inversion.The LO and the ADC can both invert the spectrum : two inversions cancel, so each step must be tracked.An uncorrected inversion reverses the subcarrier order : the digital part corrects it once, before the FFT.
Filtering IF signal
The first step after downconverting the RF to IF signal is to bandpass filter the signal as shown below. This process itself would be simple. Just passing the signal into a passive device (IF Bandpass Filter). The main purpose of this process is to deliver the clean signal (i.e, no noise outside of the signal passband area) to ADC.
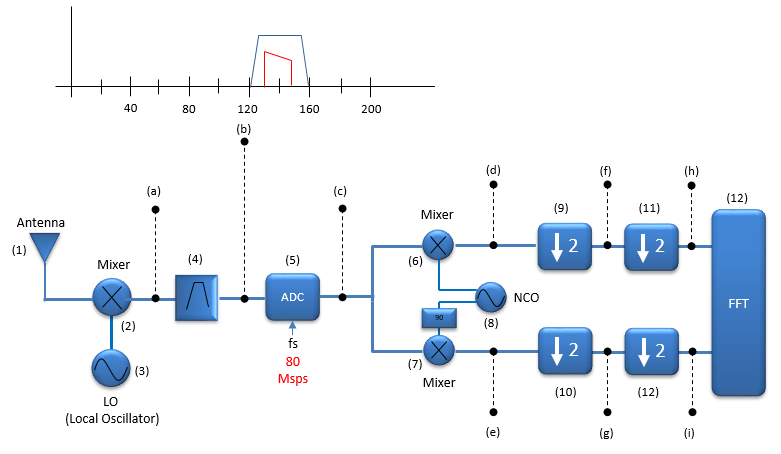
- The blue trapezoid is the passband of the IF bandpass filter (4), from about 120 MHz to 160 MHz. The red wanted signal sits inside it.
- The blue signals near 60 MHz and 180 MHz of the previous plot are gone at point (b).
Why must those signals go before the ADC, and not later in the digital part? Let's compute where they land after sampling at 80 Msps. A signal at frequency f appears at the distance between f and the nearest multiple of 80 MHz. The wanted signal at 140 MHz lands at 20 MHz, because 160 - 140 = 20. A signal at 60 MHz also lands at 20 MHz, because 80 - 60 = 20. A signal at 180 MHz lands there too, because 180 - 160 = 20. So after the ADC, both unwanted signals would sit exactly on top of the wanted one, and no digital filter could separate them again. The IF filter is therefore also the anti-aliasing filter of the ADC.
The requirement for the filter follows from the same rule. The filter must pass 130 MHz to 150 MHz. It must also reject every range that folds onto 10 MHz to 30 MHz, which means 50 to 70 MHz, 90 to 110 MHz, 170 to 190 MHz and so on. The same is true for noise in those ranges. The nearest ranges end 20 MHz below and start 20 MHz above the wanted band. So the filter has 20 MHz to fall from its passband to its stopband.
The IF filter is also the anti-aliasing filter : it removes everything that would fold onto the wanted signal in the ADC.Aliasing cannot be undone after sampling : signals at 60 MHz and 180 MHz land at exactly the same 20 MHz as the wanted signal.The sample rate sets the filter transition band : in this example the filter has 20 MHz on each side of the wanted band.
Converting Analog to Digital - Sampling
This step is the critical step in most of the modern RF front communication for digital communication system. It is to sample the analog IF signal into a sequence of digital data. Assuming that the signal is sampled at the rate of 80 Msps, the signal frequency after the digitization would be shown as follows. Now you may notice that the signal frequency shown below doesn seem to be correct (at least, intuitive).
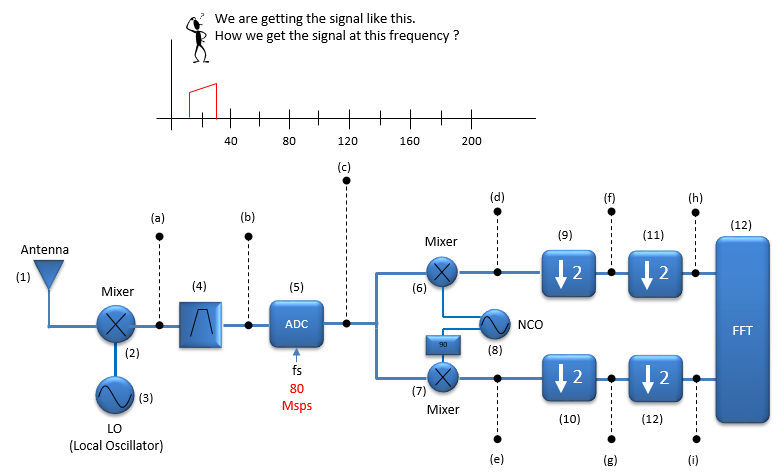
The first question that might come up to your mind would be 'why sampling at 80 Msps, not 150 (the highest frequency of the IF signal coming into ADC) ?'. Isn't this the violation of Nyquist sampling criteria ? You would see that it is not the violation of Nyquist sampling criteria in this case(See Sampling Theory page). Actually 80 Mhz is oversampling of the signal.
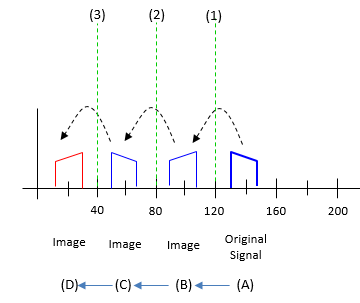
Next question popping up in your mind would be 'How the sampled signal frequency get so low ?'. One of the most important law in Digital Signal Processing(DSP) would be 'If you digitize an analog signal into digital data, always multiple number of image signal are generated (actually infinite number of image signal are generated if you observe the signal from -Infinity to +Infinity). In this case, the original signal is (A) shown below. When this is digitized at 80 Msps, the image is generated as (B) -> (C) -> (A). In most case, this kind of image is regarded as something unwanted (i.e, something to be removed), but in this case we actively use one of these image. We will use an image marked in red as the signal as the result of the sampling (ADC). In short, by this mechanism we can get the signal at the center frequency of fs/4 (4th of the sampling frequency). At this specific example, we used the sampling frequency of 80 Mhz. So the digitized data frequency we get is 20 Mhz (=80/4) as shown below.
At this point, you may have another question. What is the selection criterial for the ADC sampling frequency ? There can be a couple of factors determining this as follows.
- The ADC sampling frequency would better be much higher than the Nyquist sampling rate. It mean that we usually oversamples the signal ? Why over-samples ?
- It would make it easy to design a filter (not shown in the block diagram) for the sampled data (ADC output)
- It would be easier to design if ADC sampling rate can be easily derived from system clock (e.g, Integer multiples of the system clock or Integer division of the system clock)
Let's make the folding rule of the ADC image plot systematic. With fs = 80 Msps, the frequency axis divides into Nyquist zones of fs/2 = 40 MHz each. The range 0 to 40 MHz is zone 1, 40 to 80 MHz is zone 2, and so on. Sampling folds every zone into zone 1. An odd zone keeps the orientation of the spectrum, and an even zone inverts it. The IF band from 130 MHz to 150 MHz lies in zone 4, from 120 MHz to 160 MHz, so it arrives inverted between 10 MHz and 30 MHz. This is the spectral inversion of the Stupid Question section.
Two conditions come with this method. First, the whole band must stay inside one zone. A band that crosses 120 MHz or 160 MHz would fold onto itself. Second, the analog input of the ADC must handle 150 MHz, although the ADC samples at only 80 Msps. So the input bandwidth of the ADC, not its sample rate, must cover the IF. Sampling above fs/2 on purpose like this is called bandpass sampling, IF sampling or undersampling.
The choice of 140 MHz and 80 Msps has one more benefit. 140 MHz is 7 x fs/4, so the signal lands at exactly fs/4 = 20 MHz. The next section shows why fs/4 makes the digital mixer very cheap.
Nyquist applies to the bandwidth here, not to the carrier : a 20 MHz band needs at least 40 Msps, so 80 Msps is two times oversampling.An even Nyquist zone inverts the spectrum : the IF band sits in zone 4, so it arrives inverted.An IF at an odd multiple of fs/4 lands at fs/4 : 140 MHz = 7 x 20 MHz lands at 20 MHz.
Pusing the frequency down to Baseband
As shown above, from ADC we got the digitized signal very close to the baseband but the center frequency is still away from 0 frequency. How do we push the center frequency of the signal down to 0 ?
The logic is same as in Analog signal processing. Using the mixer and local oscillator, we can push it down to 0 frequency (baseband) as shown below. The only difference from analog frequency conversion is that we are using a digital local oscillator (NCO : Numerically Controlled Oscillator) instead of the analog oscillator. After this mixing process, the signal will be positioned at 0 frequency as shown in red below.
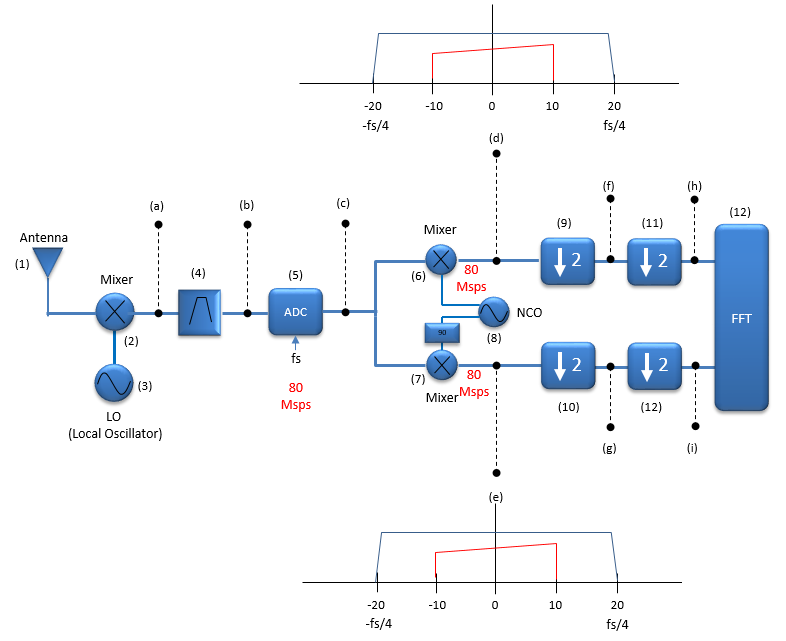
- The plots at (d) and (e) show the red signal from -10 MHz to 10 MHz, centered at 0.
- The outer blue band edges at -20 MHz and 20 MHz are marked -fs/4 and fs/4. Both mixer outputs still run at 80 Msps, as marked in red.
With this step, we get the data that can be forwarded to the DSP blocks. Theoretically this can be all we need in terms of digitization. However, we will do some additional process to reduce the number of data without losing the nature of the signal as will be explained in following section.
Let's look at what the NCO (8) computes. It shifts the signal from fs/4 = 20 MHz to 0, so it multiplies the sample with index n by e-j2πn/4. At fs/4 this sequence has only four values, 1, -j, -1 and +j, and then it repeats. The cosine for mixer (6) is 1, 0, -1, 0, and the sine for mixer (7) is 0, 1, 0, -1. So every multiplication is only a sign change or a zero, and the mixers need no real multiplier. This is why designers like to place the signal at fs/4.
The same step can also correct the spectral inversion. A real signal after the ADC has two copies, one at +20 MHz and one at -20 MHz. In this example the copy at +20 MHz is inverted, and the copy at -20 MHz has the original orientation. If the NCO shifts the +20 MHz copy to 0, the result is still inverted, and the receiver changes the sign of Q to correct it. Alternatively, the NCO shifts the -20 MHz copy up to 0 instead, and the result is not inverted.
The NCO is a digital LO : it shifts the signal from fs/4 to 0 and produces I and Q.A shift of fs/4 needs no multiplier : the NCO values are only 1, 0 and -1.Changing the sign of Q undoes a spectral inversion : it takes the complex conjugate of the baseband signal.
Reducing the number of samples
As mentioned above, theoretically the previous step (i.e, downconvert the digital signal to baseband). However, we are trying to do some additional steps to reduce the number of data without losing the nature of the signal.
Why do we need to do this ?
Reduced number of sample mean that DSP block can process the data with less number of operation. It means it can reduce the requirement of DSP chips in terms of processing power which would mean lowering the cost and also reduce power consumtion as well.
First step is (9) and (10) which downs-samples the signal by 2. The reason behind this is... when a signal is separated into I and Q, we can downsample the data by two without losing the nature of the original data. With this specific example, the signal bandwidth is 20 Mhz and after this step we get I and Q with 40 Msps as indicated at (f) and (g). If this is not the I/Q data, this would be the best we can do which 40 Msps is the Nyquist limit of 20 Mhz BW signal. But since this is I/Q data, we can do one more downsample-by-2 for I and Q as indicated by step (11) and (12). In this specific example, we get I data with 20 Msps and Q data with 20 Msps as indicated in (h) and (i).
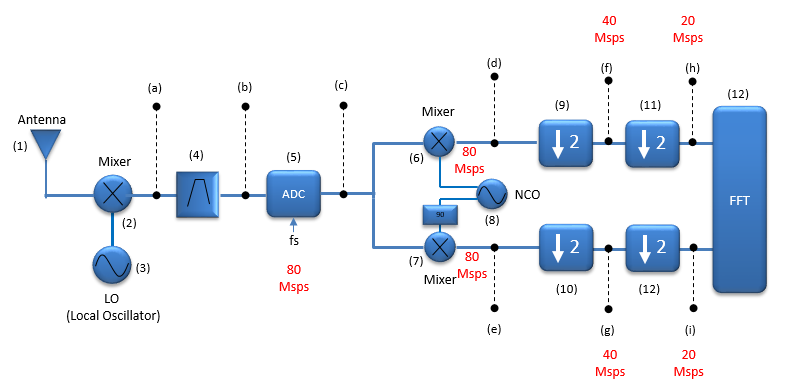
- The sample rate is 80 Msps at the ADC and at both mixer outputs.
- It is 40 Msps at (f) and (g), after the first decimate by 2 stage, and 20 Msps at (h) and (i), after the second.
Let's count what the two stages save. Each branch leaves its mixer at 80 Msps and reaches the FFT at 20 Msps, so the DSP handles one quarter of the samples. Together, I and Q still carry 40 million numbers per second. That is two times the 20 MHz bandwidth, the same count as a real signal sampled at its Nyquist rate. So nothing is lost, as long as the signal really fits into 20 MHz.
Each stage is usually built as a half band filter followed by keeping every second sample. Almost half of the coefficients of a half band filter are zero, so the filter is cheap. The More questions section explains why the filter cannot be left out.
80 Msps becomes 20 Msps in two steps : the DSP load drops to one quarter.Complex samples at 20 Msps cover 20 MHz : I and Q together still give two numbers per Hz of bandwidth.Each decimate by 2 stage has its own filter : a half band filter is the usual choice.
More questions ?
We have gone through overal signal flow along a RF Rx chain and I think (hope) you would get the general idea on how it works. Now take a look at the original diagram again and see how much you can explain about this on your own words.
While going through each components of the path, you may get a lot of other questions boggling in your mind. Followings are the list of questions that popped up in my mind and the list gets longer as I think more in detail.
- How to determine the IF frequency (i.e, the frequency at point (a)) ?
- How to determine the bit resolution of ADC ?
- In most of RF application, the signal frequency(channel frequency) coming into the antenna(1) varies, but eventually the center frequency of the signal should go down to 0(baseband) at the point (d). How do we get the varying signal frequency down to a constant frequency(i.e, 0 frequency) ? By changing LO(3) frequency ? or by changing NCO(8) frequency ?
- How downsampling (9,10,11,12) works ? Is it just taking a few data away from the original data in a certain interval ?
- Where is FIFO(First In First Out) involved in this process ?
How to determine the IF frequency (i.e, the frequency at point (a)) ?
There are several factors determining on this and the answer may vary a little bit of the overall design and application, but followings would be major factors.
- ADC Sampling Rate : The IF frequency should be low enough to be sampled by ADC without losing the nature of the signal.
- The IF frequency should be in the range where we can find easily the IF filters. The specificationo of IF filter should not be too tight.
The example on this page adds three more factors. The first is the Nyquist zone. The IF band must sit inside one zone of the ADC, and 130 MHz to 150 MHz sits inside 120 MHz to 160 MHz. The second is the fs/4 position. An IF at an odd multiple of fs/4, here 140 MHz = 7 x 20 MHz, lands at fs/4 and makes the NCO trivial. The third is on the RF side. A higher IF moves the image frequency further from the wanted channel, because the distance is 2 x IF. So the RF filter before the mixer can remove the image more easily.
How to determine the bit resolution of ADC ?
Theoretically ADC Bit Resolution determines the accuracy of the digitized sample, i.e, the degree of quantization error (See ADC page for the basic principle of ADC). As the bit resolution gets larger, the quantization error gets smaller. As quantization gets smaller, you would get better SNR for the signal coming out of the ADC. Roughly if you increase the bit resolution of ADC by 1, you would get around 6 dB gain in SNR (See here for further details).
Simply put, if you use an ADC with higher bit resolution you would get better signal. But downside would be that you would need higher processing power and memory requirement.
A useful formula for an ideal ADC with N bits and a full scale sine input is SNR = 6.02 N + 1.76 dB. So 10 bits give about 62 dB, 12 bits give 74 dB and 14 bits give 86 dB. Oversampling adds to this. The quantization noise spreads over 0 to fs/2, but the receiver keeps only the signal bandwidth. In this example fs/2 is 40 MHz and the signal is 20 MHz wide. The digital filters remove half of the noise, so the SNR improves by 10 log(40/20) = 3 dB.
At an IF as high as 140 MHz, clock jitter also limits the SNR. For a sine at frequency f and an rms jitter tj, the limit is SNR = -20 log(2π f tj). With 0.5 ps of jitter at 140 MHz, the limit is 67 dB. That is lower than the 74 dB of an ideal 12 bit ADC. So at a high IF, more bits help only if the sampling clock is clean enough.
In most of RF application, the signal frequency(channel frequency) coming into the antenna(1) varies, but eventually the center frequency of the signal should go down to 0(baseband) at the point (d). How do we get the varying signal frequency down to a constant frequency(i.e, 0 frequency) ? By changing LO(3) frequency ? or by changing NCO(8) frequency ?
The answer may vary depending how you design/implement the overall reciver path. But the most common answer would be 'By chaning LO(3) frequency'. It means we usually design the RF reciever path in such a way that IF frequency is always same regardless of the signal frequency coming into Antenna.
Why ?
If the IF frequecy varies, we need to use a lot of different IF filters(4) with different center frequency which is not practical in many ways.
Some designs split the tuning between the two oscillators. The LO(3) moves in coarse steps and places the channel roughly at the IF. The NCO(8) then does the fine tuning inside the passband of the IF filter. The NCO frequency is only a number in a register, so it can change in very fine steps and very fast. A wideband receiver can also run several NCOs on the same ADC samples, one per channel. See Ref [6] for a multichannel design of this type.
How downsampling (9,10,11,12) works ? Is it just taking a few data away from the original data in a certain interval ?
No. Keeping every second sample is only the second half of the job. Before that, a low pass filter must remove everything that would fold into the band at the new, lower rate. Let's check the first stage. At 80 Msps the complex band runs from -40 MHz to 40 MHz. At 40 Msps it runs only from -20 MHz to 20 MHz, and a component at f appears at f - 40 MHz or f + 40 MHz. So a component between 30 MHz and 40 MHz would land between -10 MHz and 0 MHz, inside the wanted signal. The filter must remove it before the samples are dropped.
The second stage, from 40 Msps to 20 Msps, is tighter. A component between 10 MHz and 20 MHz lands between -10 MHz and 0 MHz, and the wanted signal fills the whole range from -10 MHz to 10 MHz. So the filter has no room for a transition band. A real design keeps some margin: the final rate is a little higher than the bandwidth, or the occupied signal is a little narrower. The FPGA/DDC in the diagram under the next question draws exactly this pair, a Low pass Filter followed by a Decimater.
Where is FIFO(First In First Out) and DSP involved in this process ?
The diagram below maps the blocks of this tutorial onto hardware. The upper chain is the tutorial diagram, and the lines show which of its blocks go into which part of the lower chain.
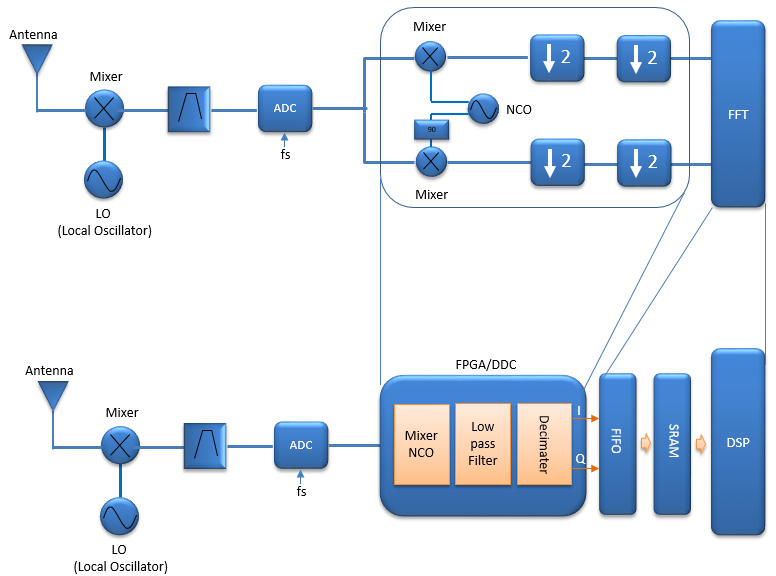
- The digital mixers, the NCO and the four decimate by 2 blocks become one FPGA/DDC block with Mixer NCO, Low pass Filter and Decimater. DDC stands for digital downconverter.
- The I and Q outputs go to a FIFO, then to SRAM, and then to the DSP, which takes the place of the FFT block.
Why is the FIFO needed? The DDC runs on the ADC clock and produces a steady stream, one I and Q pair every 50 ns at 20 Msps. The DSP works in blocks, for example one FFT at a time, and it runs on its own clock. The FIFO takes the stream in on one clock and hands it out on the other. So neither side has to wait for the other. The SRAM then holds complete blocks until the DSP processes them.
The IF, the sample rate and the NCO are chosen together : 140 MHz at 80 Msps lands at fs/4 inside one Nyquist zone.Clock jitter can limit the SNR before the bit count does : 0.5 ps at 140 MHz limits the SNR to 67 dB.Decimation is filtering plus dropping samples : without the filter, out of band signals fold onto the wanted signal.A FIFO connects the sample stream to the block processing : the DDC and the DSP run on different clocks.
Reference
[1] Handling Spectral Inversion in Baseband Processing
[2] Spectral Flipping Around Signal Center Frequency
[3] A Quadrature Signals Tutorial: Complex, But Not Complicated
[5] SNR to Resolution converter
[6] Designing a 256-Channel Digital Downconverter