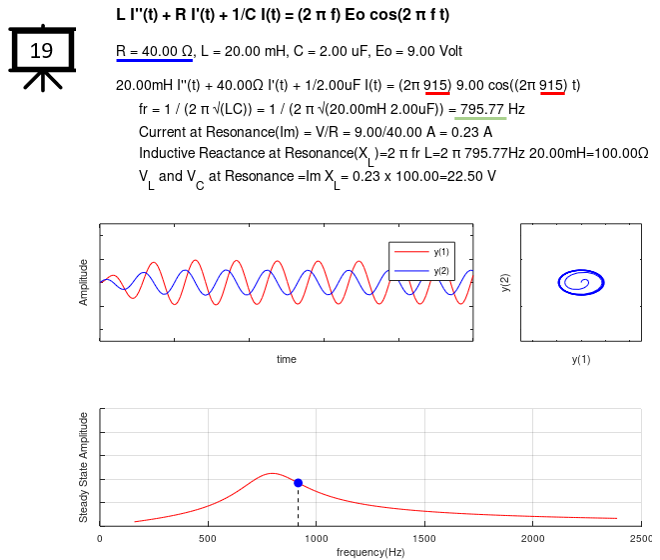
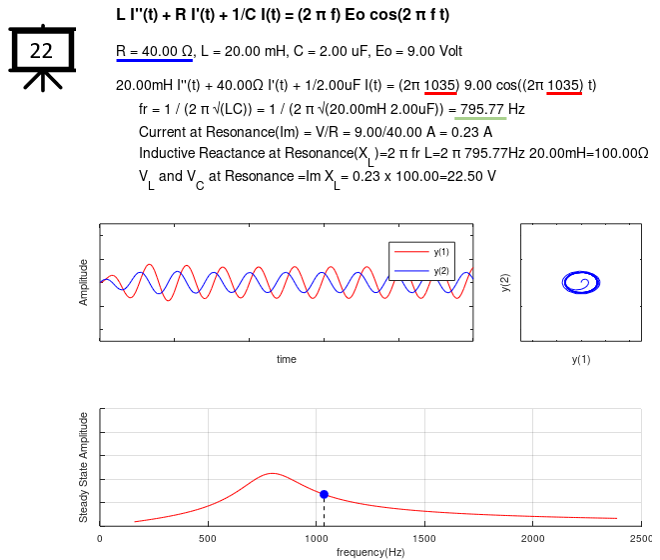
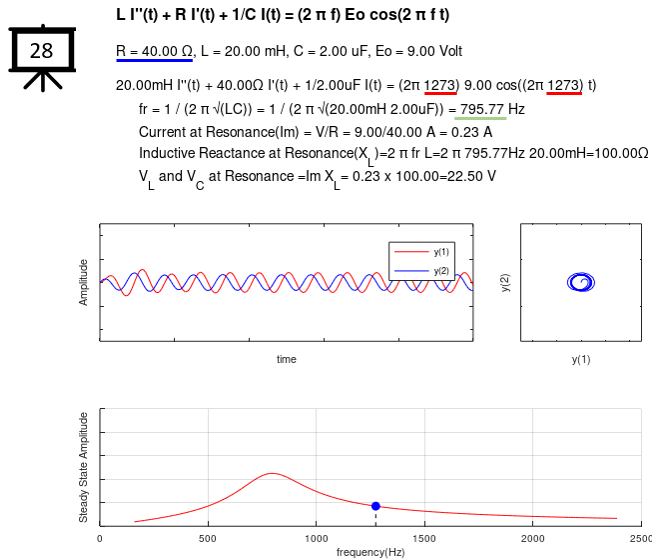
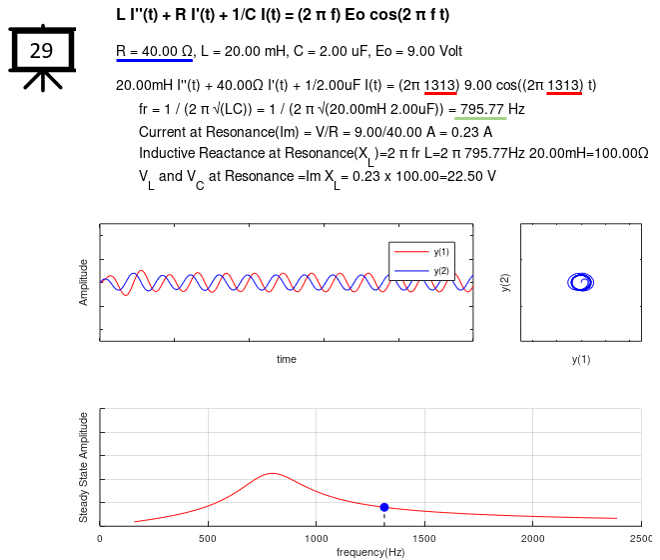
|
< Code 1 >
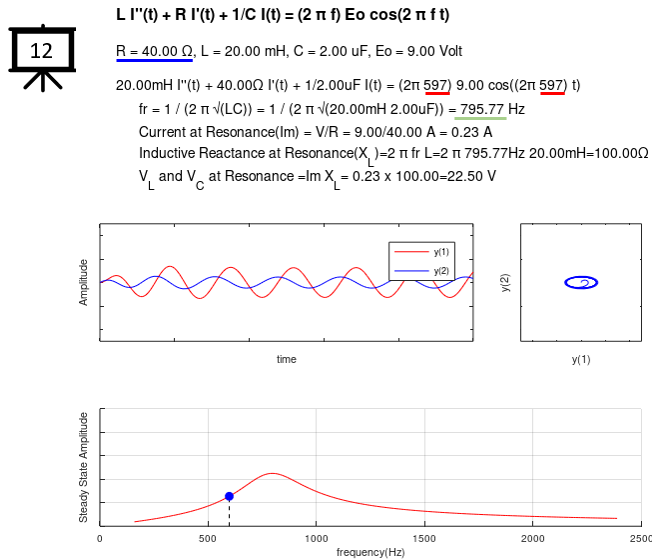
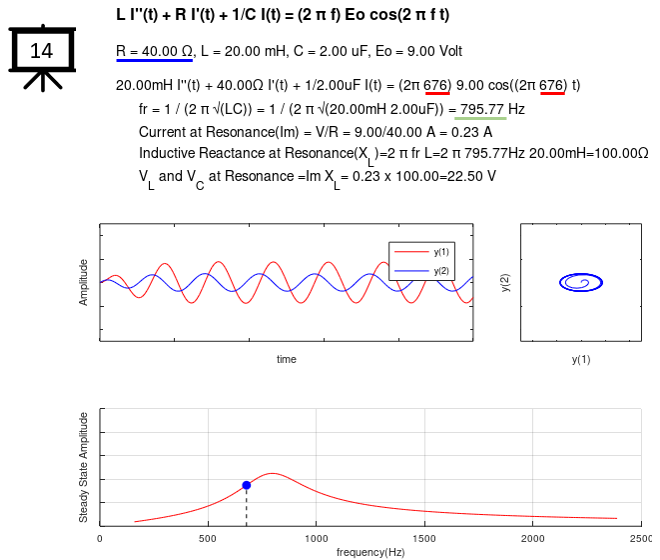
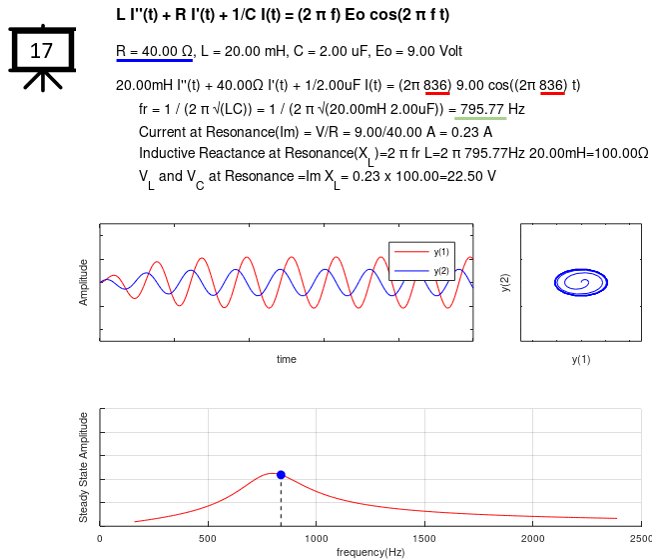
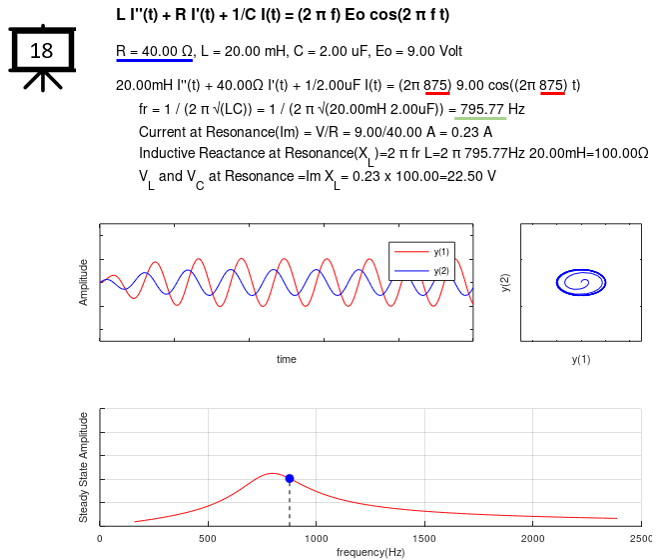
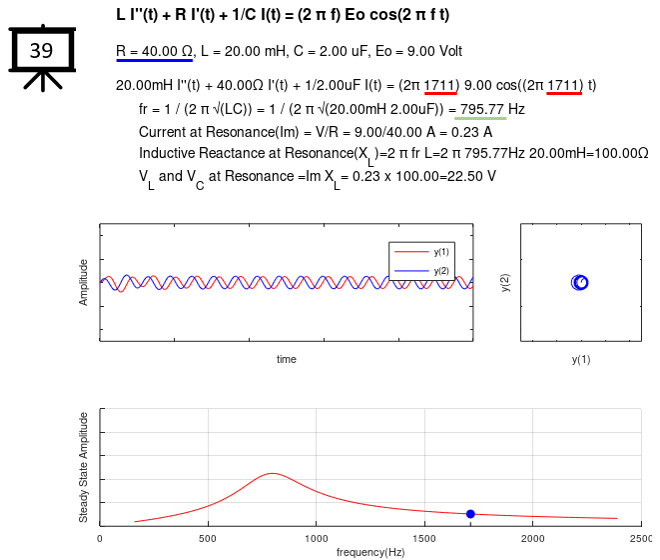
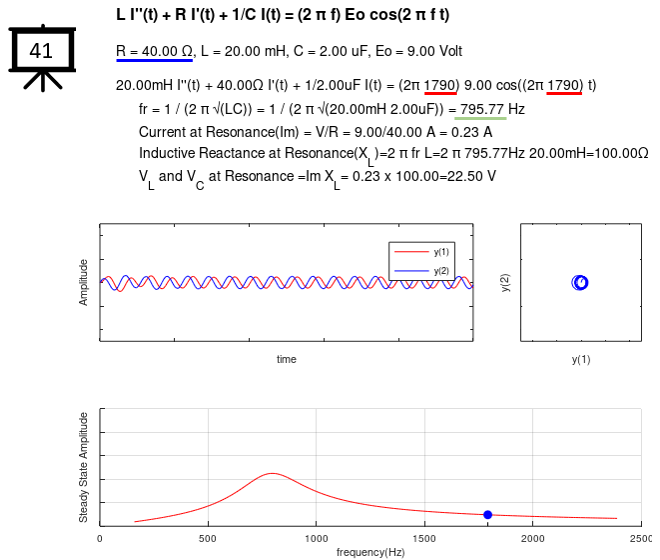
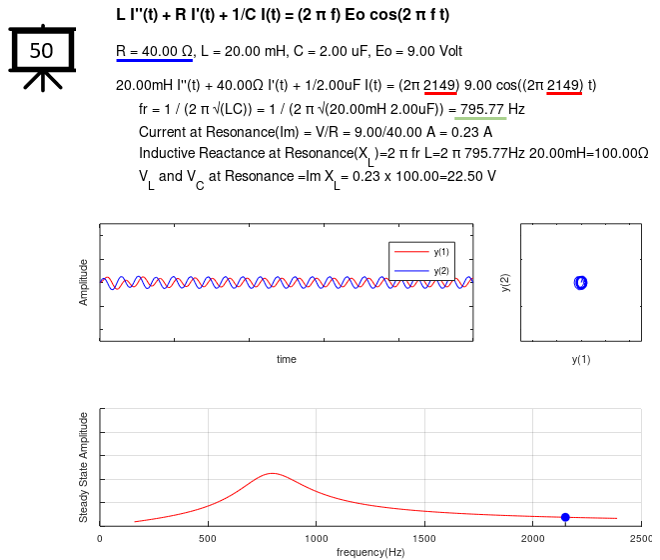
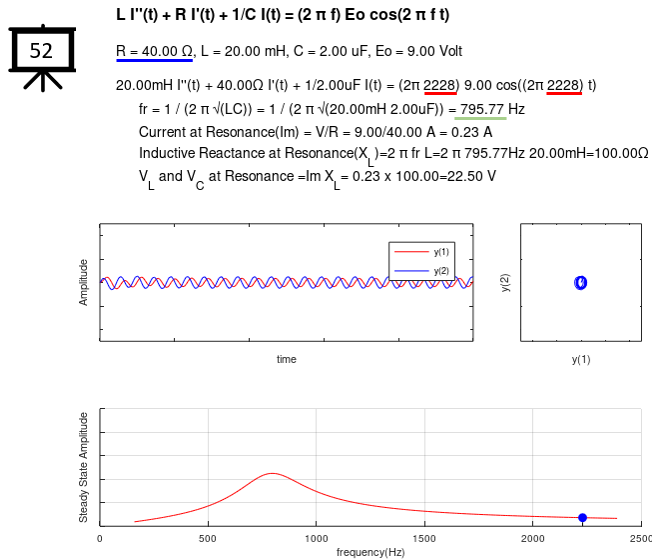
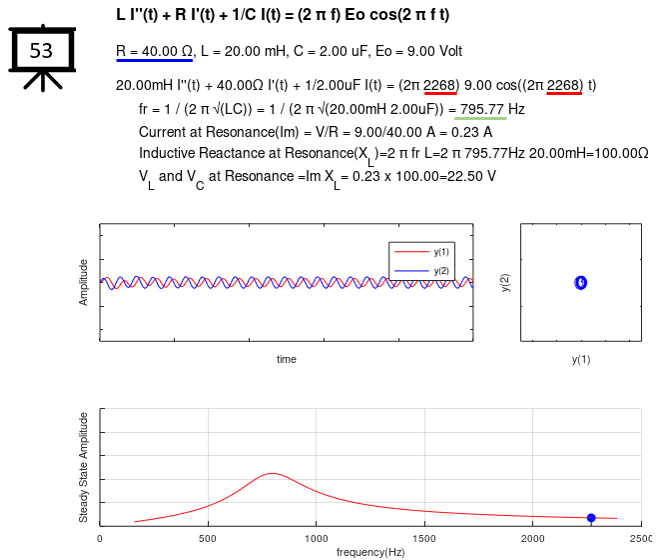
R = 40;
L = 20 * (10^-3);
C = 2 * (10^-6);
E0 = 9;
w0 = 1/(2*pi*sqrt(L*C));
tmax = 10 * 10^-3;
yinit = 0.0;
hFig = figure(1,'Position',[300 300 700 600]);
n = 56;
f = w0*0.2 + n*w0/20;
w = 2 * pi * f;
dy_dt = @(t,y) [y(2);...
-(R/L) * y(2) - (1/(L*C)) * y(1) + w * (E0/L) * cos(w*t)];
odeopt = odeset ('RelTol', 0.00001, 'AbsTol', 0.00001,'InitialStep',0.5,'MaxStep',0.5);
[t,y] = ode45(dy_dt,[0 tmax], [yinit 0.0],odeopt);
subplot(3,7,[1 7] );
tx = 0.2;
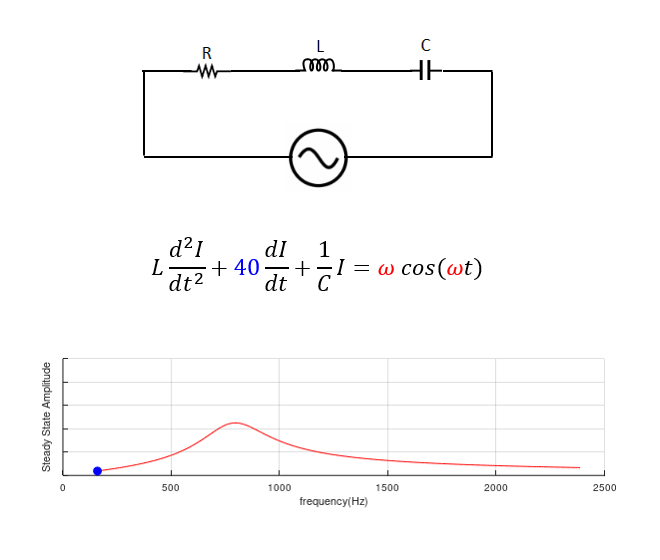
text(tx,1.2,"L I''(t) + R I'(t) + 1/C I(t) = (2 \\pi f) Eo cos(2 \\pi f t)",'FontSize',16,'fontweight','bold');
tx = 0.2;
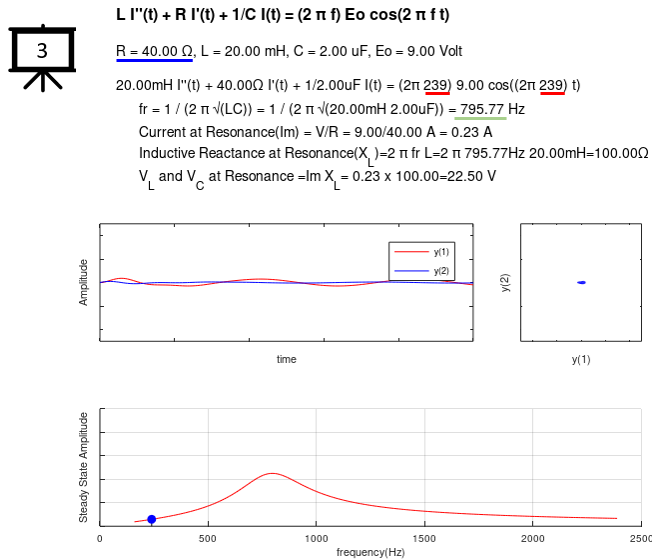
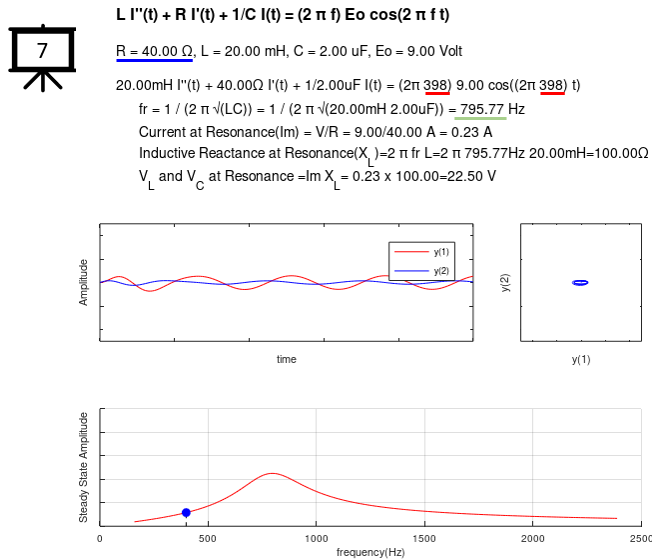
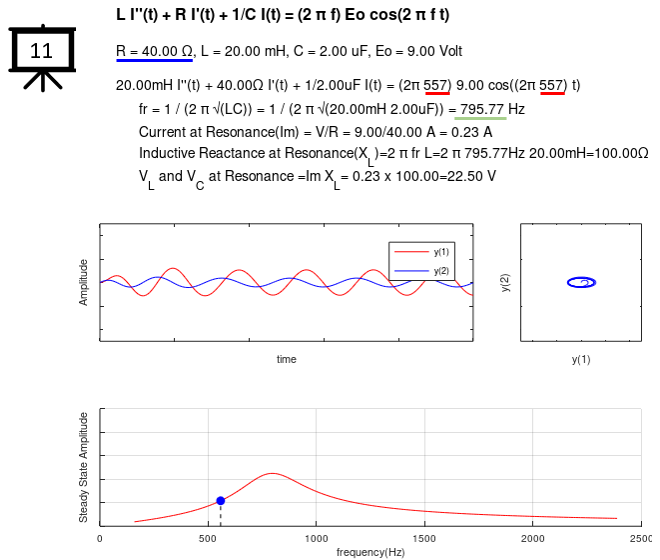
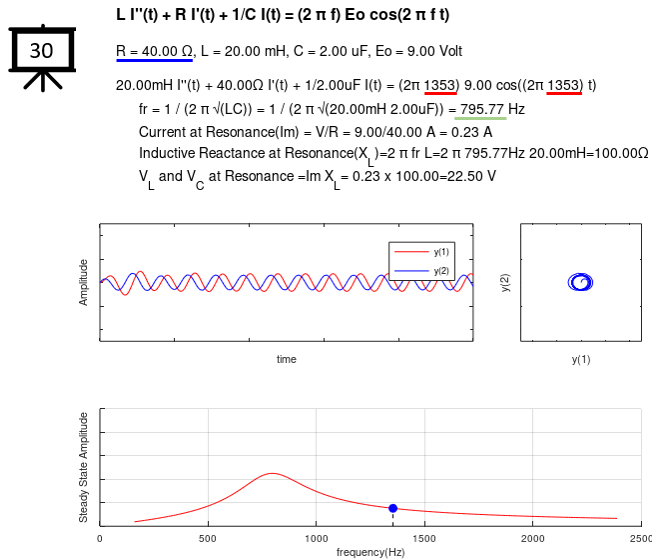
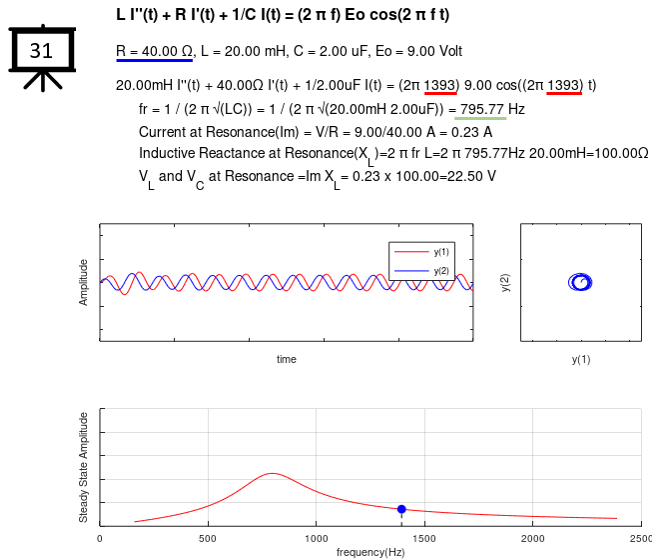
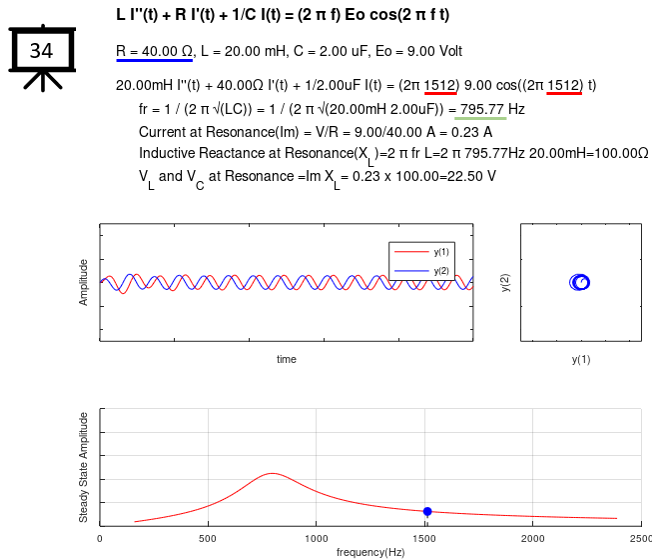
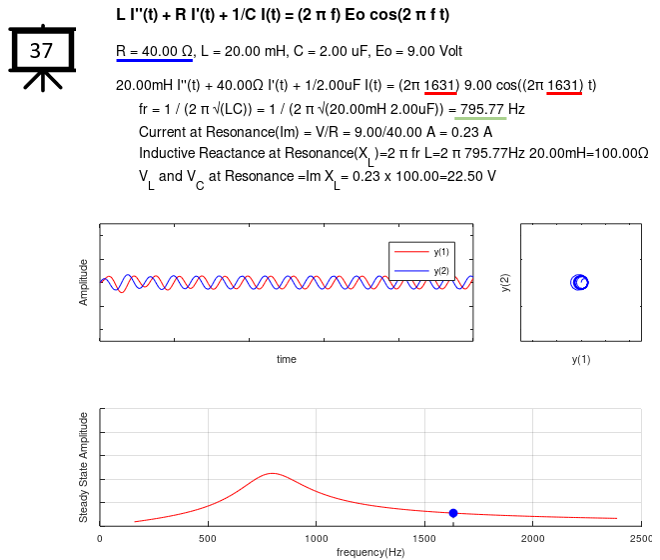
tStr = sprintf("R = %0.2f \\Omega, L = %0.2f mH, C = %0.2f uF, Eo = %0.2f Volt",R,L*10^3,C*10^6,E0);
text(tx,0.9,tStr,'FontSize',14);
tStr = sprintf("%0.2fmH I''(t) + %0.2f\\Omega I'(t) + 1/%0.2fuF I(t) = (2\\pi %d) %0.02f cos((2\\pi %d) t)", ...
L*10^3,R,C*10^6,round(f),E0,round(f));
text(tx,0.6,tStr,'FontSize',14);
tx = 0.5;
tStr = sprintf("fr = 1 / (2 \\pi \\surd{(LC)}) = 1 / (2 \\pi \\surd{(%0.2fmH %0.2fuF)}) = %0.2f Hz",L*10^3,C*10^6,w0);
text(tx,0.4,tStr,'FontSize',14);
Im = E0/R;
tStr = sprintf("Current at Resonance(Im) = V/R = %0.2f/%0.2f A = %0.2f A",E0,R,Im) ;
text(tx,0.2,tStr,'FontSize',14);
XL = 2 * pi * w0 * L;
tStr = sprintf("Inductive Reactance at Resonance(X_L)=2 \\pi fr L=2 \\pi %0.2fHz %0.2fmH=%0.2f\\Omega",w0,L*10^3,XL) ;
text(tx,0.0,tStr,'FontSize',14);
VL = Im * XL;
tStr = sprintf("V_L and V_C at Resonance =Im X_L= %0.2f x %0.2f=%0.2f V",Im,XL,VL) ;
text(tx,-0.2,tStr,'FontSize',14);
axis([0 7 0 1]);
set(gca,'Visible','off')
y1scale = 1;
y2scale = 1/10000;
subplot(3,7,[8 12] );
plot(t,y1scale*y(:,1),'r-',t,y2scale*y(:,2),'b-');
ylim([-0.5 0.5]);
legend('y(1)','y(2)');
xlabel('time');
ylabel('Amplitude');
set(gca,'xticklabel',[]);
set(gca,'yticklabel',[]);
subplot(3,7,[13 14]);
plot(y1scale*y(:,1),y2scale*y(:,2),'b-');
xlim([-0.5 0.5]); ylim([-0.5 0.5]);
xlabel('y(1)');
ylabel('y(2)');
set(gca,'xticklabel',[]);
set(gca,'yticklabel',[]);
subplot(3,7,[15 21]);
w = linspace(w0*0.2,w0*3.0,200);
nw = 2*pi*w;
nf = 2*pi*f;
Amp = (nw*E0) ./ sqrt((L*(nw.^2) - (1/C)).^2 + (R*nw).^2 );
Ap = (nf*E0) ./ sqrt((L*(nf.^2) - (1/C)).^2 + (R*nf).^2 );
hold on;
plot(w,Amp,'r-');
plot([f f],[0 Ap],'k--');
plot([f],[Ap],'bo','MarkerFaceColor',[0 0 1],'MarkerSize',8);
xlabel('frequency(Hz)');
ylabel('Steady State Amplitude');
ylim([0 0.5]);
%axis([0 3 0 2]);
set(gca,'yticklabel',[]);
grid on;
hold off;
|